-
Notifications
You must be signed in to change notification settings - Fork 5
UECDataSheet
The UtilityExpressionCalculator (UEC) is a Java package that reads and interprets an Excel workbook; the workbook specifies and identifies input variables for a nest or multinomial logit model. The DataSheet defines the data files input to the model, including zonal (vector) data and skim (matrix) data. The UtilitySheet specifies the structure and utility expressions of the model.
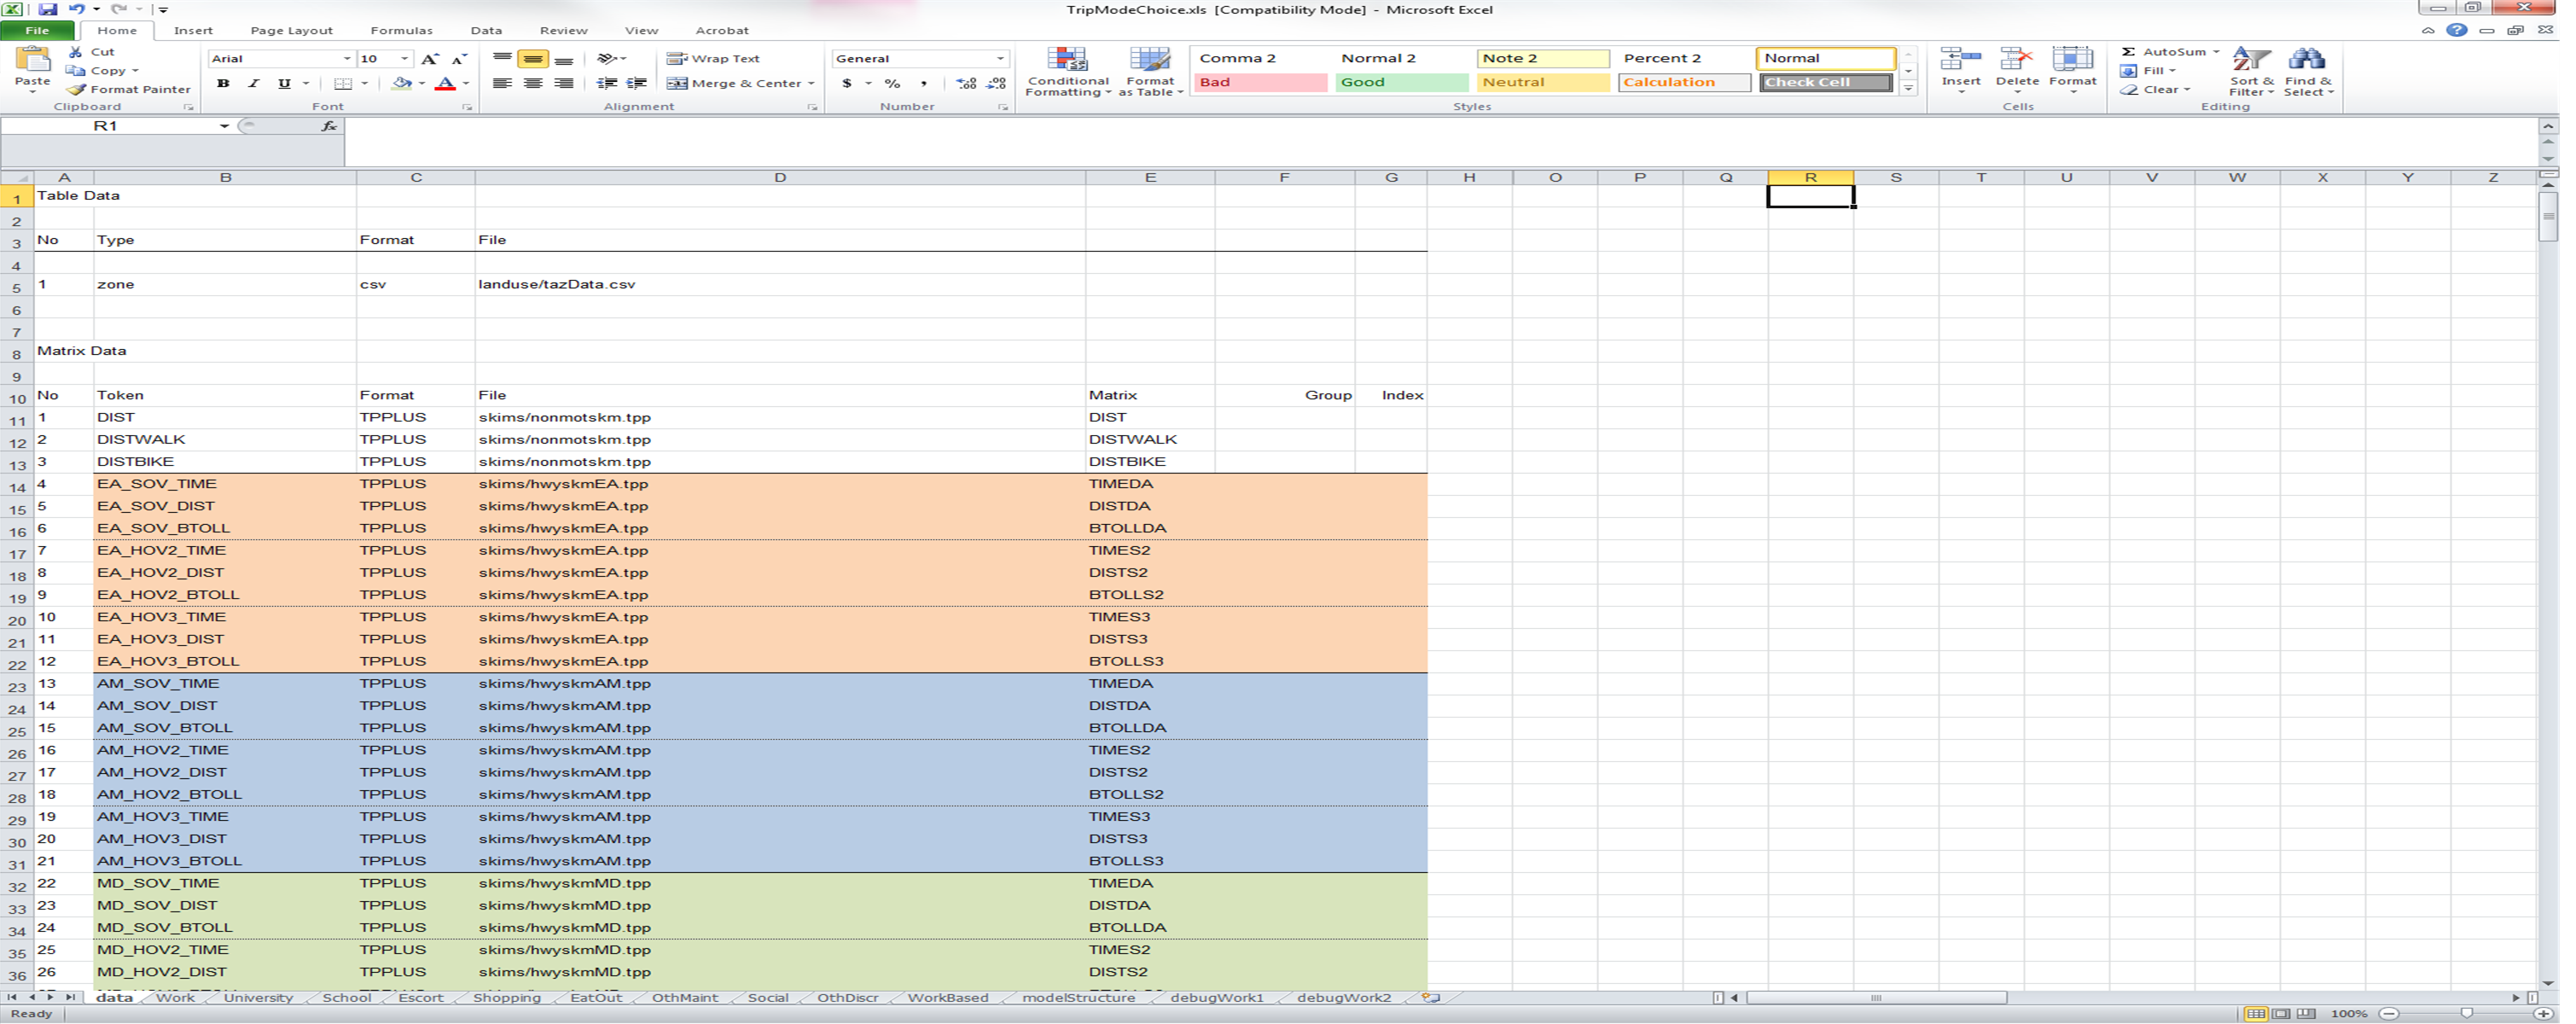
An example of a partial DataSheet is displayed below.

There are two sections to the DataSheet. The first contains table (or vector) data (i.e. flat files) that may include zone-, household-, or person-specific data (note that household- and person-specific data that is used across numerous logit models can be stored within CT-RAMP and accessed by the models via the DMU objects). Each table data item must be identified with a unique and sequential number. In the above example, there is a single table data set indexed by "zone", stored in comma-separated value (CSV) format (with header rows). The file is named "tazData.csv". The location of table data sets can reference objects stored in the resource bundle using the % symbol (see the Project.Directory example on the UtilityExpressionCalculator page). Travel analysis zone (TAZ)-specific variables should be indexed with a unique number; the field identifying the index is referenced in the UtilitySheet.
The second section of the DataSheet contains skim (or matrix) data. Each matrix item must be identified with a unique and sequential number. A unique Token is provided for each matrix; this token name can then be used in the UtilitySheet to access the data stored in the matrix. The Format of the matrix is also given and can be any of the following: TPPLUS (refers to matrices in Cube format); TRANSCAD (Trans CAD format); EMME2 (emme format); or BINARY (a format that can be written and read by the CT-RAMP software). The File column identifies the location of the matrix within the folder structure. And, the Matrix column identifies the name of the matrix (and will differ across software packages).
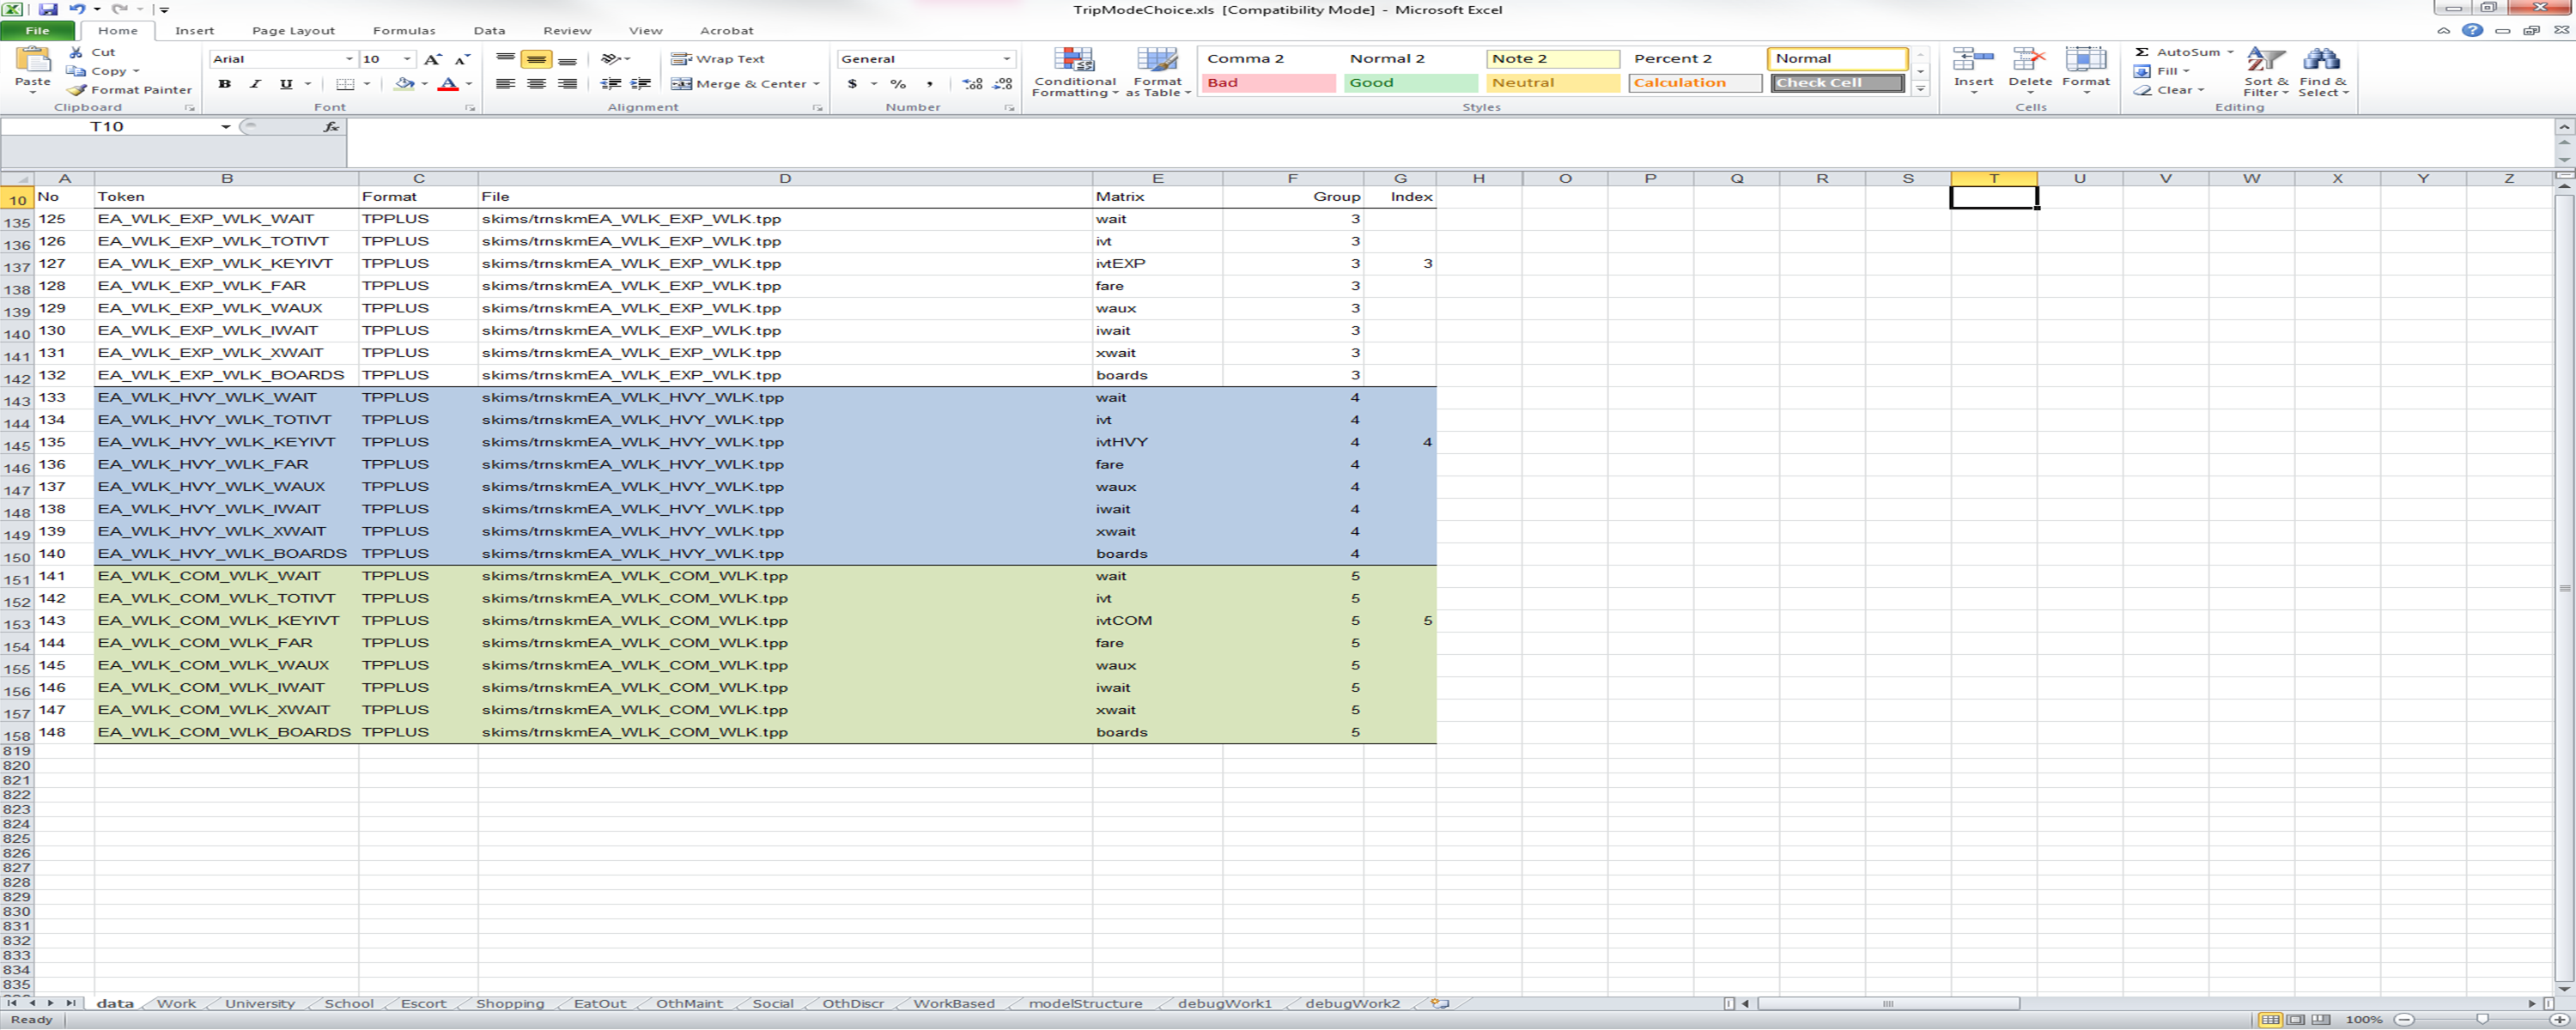
The next two files are used to improve the efficiency with which matrices are stored. Sparse matrices (e.g., transit skims) can be efficiently stored in memory by eliminating zone pairs that are unconnected by the skimmed path. For example, a region that has relatively few express bus lines will have many zone pairs that are not connected via an express bus-specific path. In this case, all express bus skim tables (e.g., number of transfers, first wait time, etc) can be ignored if the skim table containing the in-vehicle time variable is zero. The Group column identifies each skim table that is a part of a single group; the Index column identifies which table determines whether the other tables in the group should be stored in memory for a given origin-destination pair. This is typically done for transit skims, where path-specific skim tables are defined as a single Group and the in-vehicle table for the mode-defining path is set as the Index. For example, the express bus in-vehicle time could serve as the Index for a group of skim tables that define the walk to express bus path. The image below provides an example. The other columns in the Excel DataSheet can be used for annotation (they are ignored by the software); formatting with color shading and font highlighting can further enhance the usability of the UEC DataSheet files.

-- Main.DavidOry - 20 Dec 2011
Previously the MTC/ABAG Analytical Modeling Wiki (http://analytics.mtc.ca.gov/foswiki/Main/WebHome)
Please email lzorn@bayareametro.gov if you find anything missing here.