-
Notifications
You must be signed in to change notification settings - Fork 194
[Perf] High Allocator DefaultHttpContext #402
Comments
|
@benaadams - images aren't loading. Hmm looks like it's github's fault. |
|
@rynowak better? (Have a PR for this) |
|
yeah images are showing up now. |
|
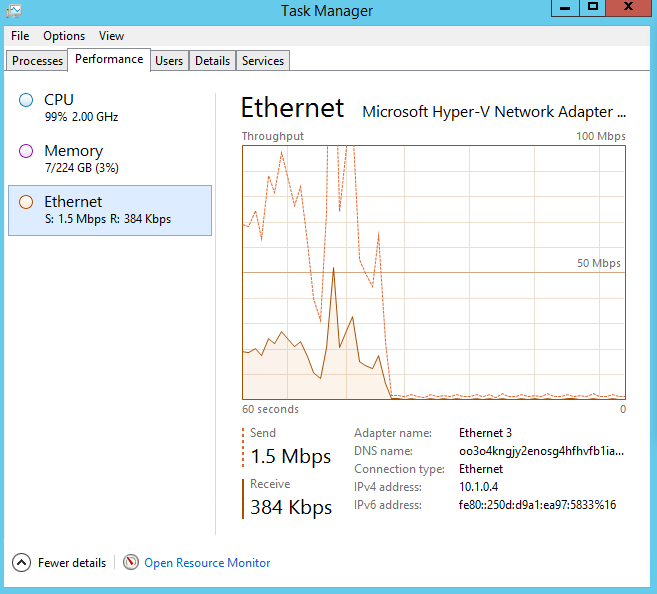
Using the Test aspnet site: https://github.com/benaadams/IllyriadGames.Server.Web.River.Test on the server https://www.nuget.org/packages/IllyriadGames.Server.Web.River (x64 coreclr beta8) Before this change and aspnet/DependencyInjection#289 running a 10 second test allows 311,043 rps: However the GC load is very high so running the test for 3 minutes causes the network to periodically flatline as it goes 100% on GC; which means it can only do 61,468 rps with very high latencies: With these two (three PRs) changes running the same server for 3 minutes is very consistent network performance and is performing 1,490,975 rps with much much lower latency: For reference the raw RIO server on this hardware+network is performing 1,991,008 rps And this is kinda the addition of the aspnet to that server; still not parsing headers 😄 So with these changes the RIO server goes from 1.99M rps -> sustained 1.49M rps by adding the aspnet layer, which is quite good; and there is still scope to improve further. Without them its 1.99M rps -> sustained 61.5k rps, max 311k rps which isn't so good. Kestrel should equally expect a performance bump, though haven't measured how much yet. |
|
@davidfowl ok if I put most findings in this Issue or do you want me to split with aspnet/DependencyInjection#288 |
|
Some background, pre-changes it starts fastish but you can see is on 100% cpu and the network performance is deteriorating over time: Eventually it completely flatlines on network even though CPU is still 100% It then recovers; though again is following same pattern of deterioration: And the results are effected heavily |
|
Top numbers were 2000 requests not 2400; updated |
|
@davidfowl wanted some more details so breakdown for bytes for first level as follows (will break them down further): |
|
The GC pauses are pretty extreme so will wait for this hotfix rollout before testing further (though that should already be in use for dnx beta8+ on coreclr?): http://blogs.msdn.com/b/maoni/archive/2015/08/12/gen2-free-list-changes-in-clr-4-6-gc.aspx |
|
Update! 1.0.0-rc1-15996 Previously for 2000 requests New for 2003 requests Drill down on Issue aspnet/KestrelHttpServer#288 So is only 61% of before and down 1.5MB per 2000 requests. However CreateContext is still Item 4 on highest allocators in plaintext test |
|
It would be good to do an analysis after the changes |


For 2000 plaintext requests DefaultHttpContext allocates 12,078 objects:
Clocking in at 927,624 bytes:
Which would mean if you were performing 1M rps the GC would have to flush 6,039,000 objects and 464 Mbytes per second, 927 Mbytes per second for 2M rps and 3.2GBytes (42.3M objects) per second for 7M rps (~10GbE saturation) or 192 GBytes per minute.
The text was updated successfully, but these errors were encountered: