docs.angularjs.org: DOM Nodes Leaking #4864
Comments
|
I found many app built with angular has the same problem. Could someone provide some solution to fix this? |
|
you might be able to help fix it by making sure that you unregister DOM and scope event handlers when possible (eg during scope '$destroy'). I expect ngRoute will $destroy $scope before compiling the new template. But, I can't promise that this will work. :( https://github.com/angular/angular.js/blob/master/src/ngRoute/directive/ngView.js#L188 scope cleanup in ngRoute, and https://github.com/angular-ui/ui-router/blob/master/src/viewDirective.js#L82 in ui-router. Unfortunately there's no real way to ensure that DOM event handlers get removed, though ._. |
|
This does appear to be a valid concern, at least on Chrome. |
|
It is also a problem on IE 11 |
|
Did a quick run of the docs on my local checkout, and while it does also leak, the Document Count stays the same throughout, unlike it does on the live site. The difference between my local docs and the live ones is Disqus. There appears to be 3 Disqus related iframes included on each doc page switch, and the Document Count seems to go up by about 3 per document page change (even with GC), so I think it's fair to say that at the very least they are leaking. But as I said, it is definitely not just disqus alone, even without it there are other DOM node and event listener leaks. |
|
|
We are going to drop Discus as it is not working as a way to request and On 12 November 2013 10:00, chylvina notifications@github.com wrote:
|
|
I reproduced this on my local, dev version which does not include disqus. I loaded the docs app and clicked on the first 10 pages in the left-hand panel At HEAD (1.2.1), I saw 19686 DOM nodes 1.1.5: 18998 nodes AFAICT, this is not a regression in 1.2.0. I've moved it out of 1.2.1 and into 1.2.x. It is super important though. Once we've pushed 1.2.1, we should re-visit this issue. |
|
I decided to look into this a bit more, after realising that some of my Angular apps were leaking too. The bad news is that there appears to be a number of entirely separate, unrelated sources of leaks. So ignoring Discus, which I already mentioned above, I found these: 1. Root scope of inline examples never gets destroyed correctly.This line 2. ngAnimate leaks.For the simple test case of switching back and forth between the input and form directive pages 10 times followed by a GC (and doing those steps over and over), it is actually possible to get rid of leaking entirely by removing ngAnimate. I went from this:
just by removing ngAnimate. As you can see there are no leaks in the second screenshot (after a GC, all counts return to the same point). I'm going to be looking at another ngAnimate issue which may very well tie in with this, so I will see if I can get to the bottom of it. 3. Detached elements, etc.So this leaves the remaining leaks, which occur when switching to a different document page every time, for example going through the first 30 links down the left hand side. I did a comparison between two profiler snapshots, the first one taken just after loading the docs site, and the second one taken after visiting 30 document page links. There's a bunch of detached DOM nodes, that are still being referenced somewhere, when they shouldn't be. For example, the divs of all previous examples are there, divs for tabs (presumably the ones on the example pages) and such. I know angular does maintain a bunch of detached nodes even under normal circumstances, but in the case of the docs, it really shouldn't be holding onto DOM from past pages. The good news is that at this point (after removing ngAnimate) the leaking won't go up indefinitely, it will just go up for every new document page that you visit. So if you visit 10 different document pages, and you revisit all of those same pages another 20 times, there will be no extra leaking during the revisits. |


|
@deakster excellent work. I'm bumping this back to 1.2.1 since some of the issues can be fixed quickly. |
|
Looking into this... |
|
@matsko is looking into the ngAnimate problem |
|
I've been chasing leakie DOM elements in our 1.1.5 app for the past week or so. We are using ng-repeat to build a table. When the user navigates to the next "page" in the table, the app changes routes. So we go from /results/1/ to results/2/ this causes the ng-repeat's compile function to be called again wiping out the "cache" (see line:15355) therefore causing a "cache" miss each time the user moves from page to page. See lines:15395 (angular v1.1.5) We are not using ngAnimate at all. Let me know how I can help or if I can provide more info. |
|
Any progress @matsko ? |
|
This problem occurs for me, even when not using My results can be seen here. |
|
+1, after 1.2.1, there is still memory leaking at docs.angularjs.org |
|
@deakster Your 3rd point is not true in my case, the leaking goes up indefinately
|
|
@blowsie My test was purely on the angular docs, with 1) ngAnimate removed completely 2) Disqus removed (running locally). I was leaking nodes for each different page I visited, but after revisiting pages that I have already visited, I had no additional leaking on top of that. So visiting 10 different doc pages, followed by a GC would show leaking. Revisiting those same 10 pages that I already hit again and again, followed by GC I wouldn't get additional leaking. I will run this test again later to verify. I also did this well before 1.2.2, so it's possible things changed since then. |
|
alrighty, I spent quite a while looking into this and my conclusion is that there is no measurable leak in docs, ngAnimate, etc. I'll be happy to be proven wrong but I need a reduced test case that does prove a leak. But let's break down the whole problem into subproblems, similarly to how @deakster did because we are dealing with several things going on here. 1. DisqusIt's gone now and that helped a bit. 2. Visiting different pages, increases memory usageThis is the expected behavior, because the first time you visit a page, we fetch the doc content for that page and cache it. So naturally because of the cache, the memory usage grow slightly each time you visit a new page. 3. V8 leaks! Yes, crazy, isn't it?!?There is a long standing issue in V8 that causes inline caches to retain references to objects from the heap. This issue has improved as several fixes were put into V8, but it's definitely still an issue. Please follow this V8 issue for more info. For this reason, when hunting for memory leaks, I recommend starting chrome with these flags that disable the optimizer and prevent these leaks while we are looking for leaks that were caused by the javascript code: On Mac I usually do: Investigating without these flags will make you go crazy as you'll see things retained in the heap that you have no references to. 4. Root scope of inline examples never gets destroyed correctlyWe do call However, from my investigation even the current behavior of 5. ngAnimate leaksThis one is very bizarre! You are right that the node count graph increases indefinitly if I navigate back and forth between two pages. however this doesn't translate to an increase in heap size or objects retained in the heap even over longer periods of time. Even more bizarrely, the problem does go away if I disable But the heap size doesn't decrease at all: This makes me think that we might be dealing with a bug in the Web Inspector and not in Angular. But again, I'm happy to revisit this if new evidence is found. 6. Detached elementsI looked into these and I do see a few, but I don't see any references from the javascript code that would be retaining them. All the references I see are DOM references, which is weird because if this is a detached DOM tree, then the thing retaining it should be JavaScript reference, but again, there is none to be found. In any case, the memory occupied by these nodes is less than 1%, so I'm not too worried about it. ConclusionWhile the node count graph does go up when All the other issues mentioned have been resolved, are expected behavior or are known issues that need to be fixed in V8. If new evidence shows up, we'll be happy to investigate again, but we need concrete code and steps to reproduce a leak |


|
Its still leaking for me, the docs and my app. Results from the docs today. Navigating to and from the
|


|
@blowsie please re-read my comment and then look at your screenshots above. the heap size doesn't seem to be increasing even though the node count does. The former is what matters. The node count does bother me, but using the web inspector, I can't find what are these retained nodes. |
|
@IgorMinar wouldn't it make sense to reach out to the DevTools guys to figure out whether it's a bug in the inspector or not? |
|
@IgorMinar The heap size does definitely increase, as you can see in the screenshots. Only a small amount, but it does increase. With a large DOM this escalates exponentially |
|
cross linking a dev tools bug that matches the symptoms we see in this issue: https://code.google.com/p/chromium/issues/detail?id=304689 |
|
my question is such a simple example will cost above 100MB memory? same example written by jquery only cost 40MB? so angular as a memory monster? |
|
Just a note for everybody looking at this issue: |
|
i have this problem too, i use the angualr 1.0.8 |
|
Thanks, @flyingmutant. It seems like incognito mode also removes whatever optimizations are causing leaks. I was struggling to understand before why incognito mode was different than normal mode with all my extensions disabled. I think this might be it. I have a test case where an angular directive pings a XMLHttp endpoint every 300ms. Here is incognito mode. Nice, frequent GCs and no slow growth:
The exact same page in normal chrome with all extensions off, running for a very similar amount of time shows memory growth despite GCs.
|


|
Seems like browsers should run through memory leak tests like the ACID tests if they are going to introduce optimizations that improve processing performance at the possible cost of memory leakage. Anyone heard of a project like this? |
|
For thoroughness, I launched Chrome as @IgorMinar suggested, with This shows an identical-looking memory usage pattern:
Because of this similarity I'm pretty confident that incognito mode is just as good for memory testing, at least in this version of Chrome (35.0.1916.153). |

|
if you can't repro the issue in incognito window it's very likely that one of your extensions is leaking memory (extensions are usually disabled in incognito mode). |
|
I was just pointing out that the leak profile for incognito and It's of course also true that incognito disables extensions. As I mentioned, I was profiling non-incognito with all extensions off, so this difference should not be important here. |
|
In a project I was working on I discovered very similar leaking behavior to the above -- that only occurred when ngAnimate was active and ng-enter animations were canceled. I discovered that if you insert this change near line 1168 of animate.js, the previously leaking detached DOM elements get garbage collected. I'm not sure if this approach is okay or not -- I haven't spent enough time exploring the details of the animate module. It seems like there's maybe a var in a closure that's not getting collected somewhere. if(removeAnimations || !data.totalActive) {
+ data.active = data.last = data.node = null;
element.removeClass(NG_ANIMATE_CLASS_NAME);
element.removeData(NG_ANIMATE_STATE);
}Could someone with more ngAnimate experience take a look into this as a possible fix? @IgorMinar? @matsko? |
|
I confirm the leak of ngAnimate, Angular 1.3.15. |
|
Maybe this helps someone. I had to debug such a problem with my app leaking memory and, after analyzing timelines and heap snapshots i found out that it was the manually set watchers on my scopes that were not cleaned on destroy. $scope.$watch(etc). after removing them, calling garbage collection manually performed a complete memory clean. I will edit this comment later today if calling the handler returned by $watch on destroy fixes the issue properly. |
|
@andreimcristof , this is surprising, because the watchers array is cleaned up on |
|
@gkalpak thank you for your reply. |
|
@gkalpak please see this example I made in plunkr, as you requested : Here is what to do :
The OS used for this repro example is Windows 10, Chrome Version "51.0.2704.103 m" Please let me know if I should provide further information. Btw, I used the version of Angular that I use in my project, I will also retest with the latest now. |
|
@andreimcristof , I tried getting to the bottom of it, but without much luck (maybe there is no bottom to get to). I run your code locally (Windows 10, Chrome v51), with the latest Angular version from master and I don't have much experience with investigating memory leaks (most probably because I don't introduce them in my code 😛), but from what I understand, part (all?) of the initial heap size increase might be caused by deoptimizations that Chrome has to make as certain objects change "shapes" and functions are being called with differently-shaped objects. |
|
@gkalpak I apologize for the very long delay in replying. Thank you very much for your time. |
|
I get the same results whether I use ngAnimate or not, tried most "solutions" in posted here but I still get a huge increase in node count. Driving me insane.. |
Please note that DOM nodes are stored in native memory so a heap size remaining the same size doesn't mean there isn't a node leak:
I'm actually dealing with a node leak right now where the heap size remains the same (about 15MB) even when the node count and tab's memory usage skyrocket (tab usage goes up to 1GB over time). |
|
In my case I found out that the problem was caused by directives using jquery , for example: Once I removed all these directives the nodes started to be garbage collected again. One thing that has helped so far is to manually destroy watchers and |
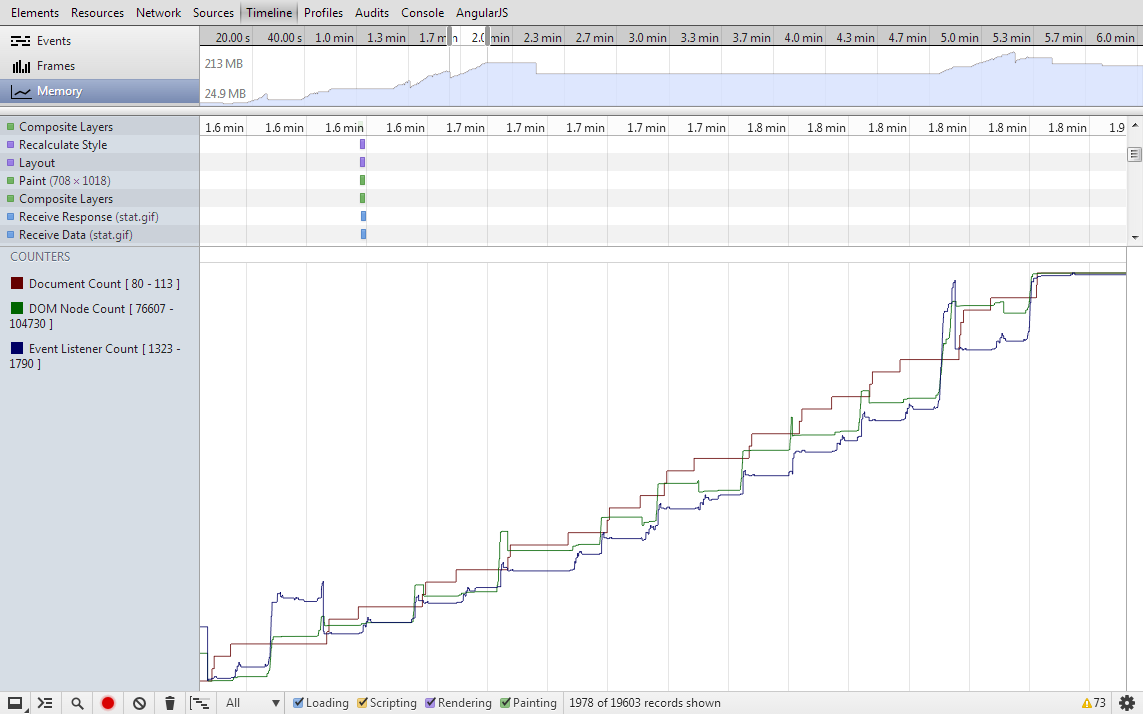
At http://docs.angularjs.org, click back and forth between pages the DOM Node Count continues to go up and up. No dramtical drop when I click "collect garbage".
The text was updated successfully, but these errors were encountered: