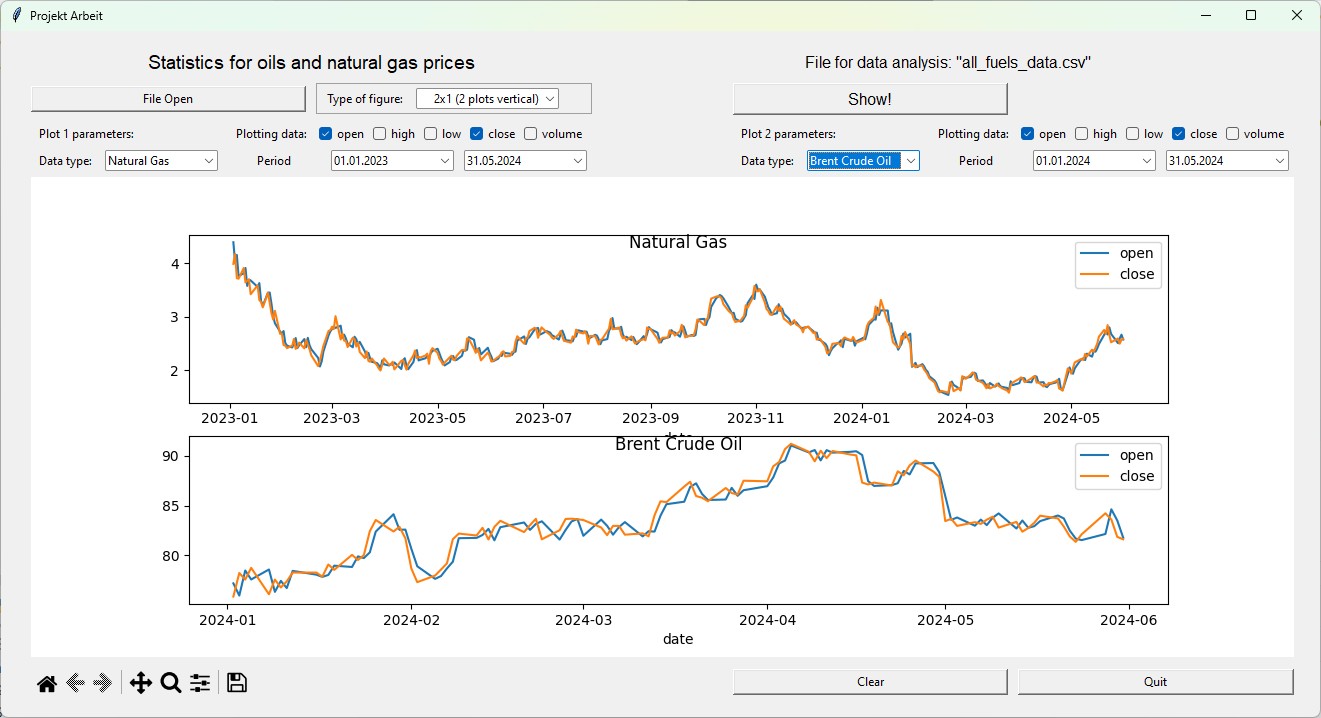
This project provides a graphical user interface (GUI) for visualizing and comparing historical fuel and natural gas prices. With a dataset spanning from August 2000 to the present, this tool allows users to analyze trends and make data-driven insights.
- 📈 Data Visualization: Compare price trends of various commodities such as crude oil, natural gas, and heating oil.
- 🎛️ Interactive Interface: User-friendly controls to filter data by date, commodity, and chart type.
- 🔄 Data Cleaning: Automatic normalization and preparation of input datasets.
- 🔍 Custom Comparisons: Simultaneously visualize two different commodities for comparative analysis.
- 📊 Multiple Plot Configurations: Choose between single or dual plots in horizontal or vertical layouts.
Ensure you have the following installed on your system:
- Python 3.8+
- Required Python libraries:
pip install pandas matplotlib tk tkcalendar
The dataset used in this project is sourced from Kaggle:
Fuels Futures Data
Download the dataset and ensure it's in the required CSV format for compatibility.
- Clone this repository:
git clone git@github.com:whellcome/all_fuels_viz.git
- Navigate to the project directory:
cd all_fuels_viz/code - Run the application:
python all_fuels_viz.py
- Tkinter-based GUI: Provides an intuitive interface for users to interact with data.
- Matplotlib Integration: Powers the chart rendering within the application.
- Data Processing: Built-in functions for cleaning, normalizing, and filtering data.
- Load a dataset via the "File Open" button.
- Select the commodity and date range for analysis.
- Customize the plot layout and compare different commodities.
- View and analyze the trends in real-time.

Example: Comparison of Natural Gas and Crude Oil Prices
- Integration with real-time data APIs for live updates.
- Advanced statistical analysis tools.
- Export options for generated charts.
Contributions are welcome! Please feel free to fork this repository and submit pull requests with improvements.
This project is licensed under the MIT License. See the LICENSE file for details.
- Dataset sourced from Kaggle (Fuels Futures Data).
- Built using Python's Tkinter and Matplotlib libraries.


