Demo: https://safepin.herokuapp.com/
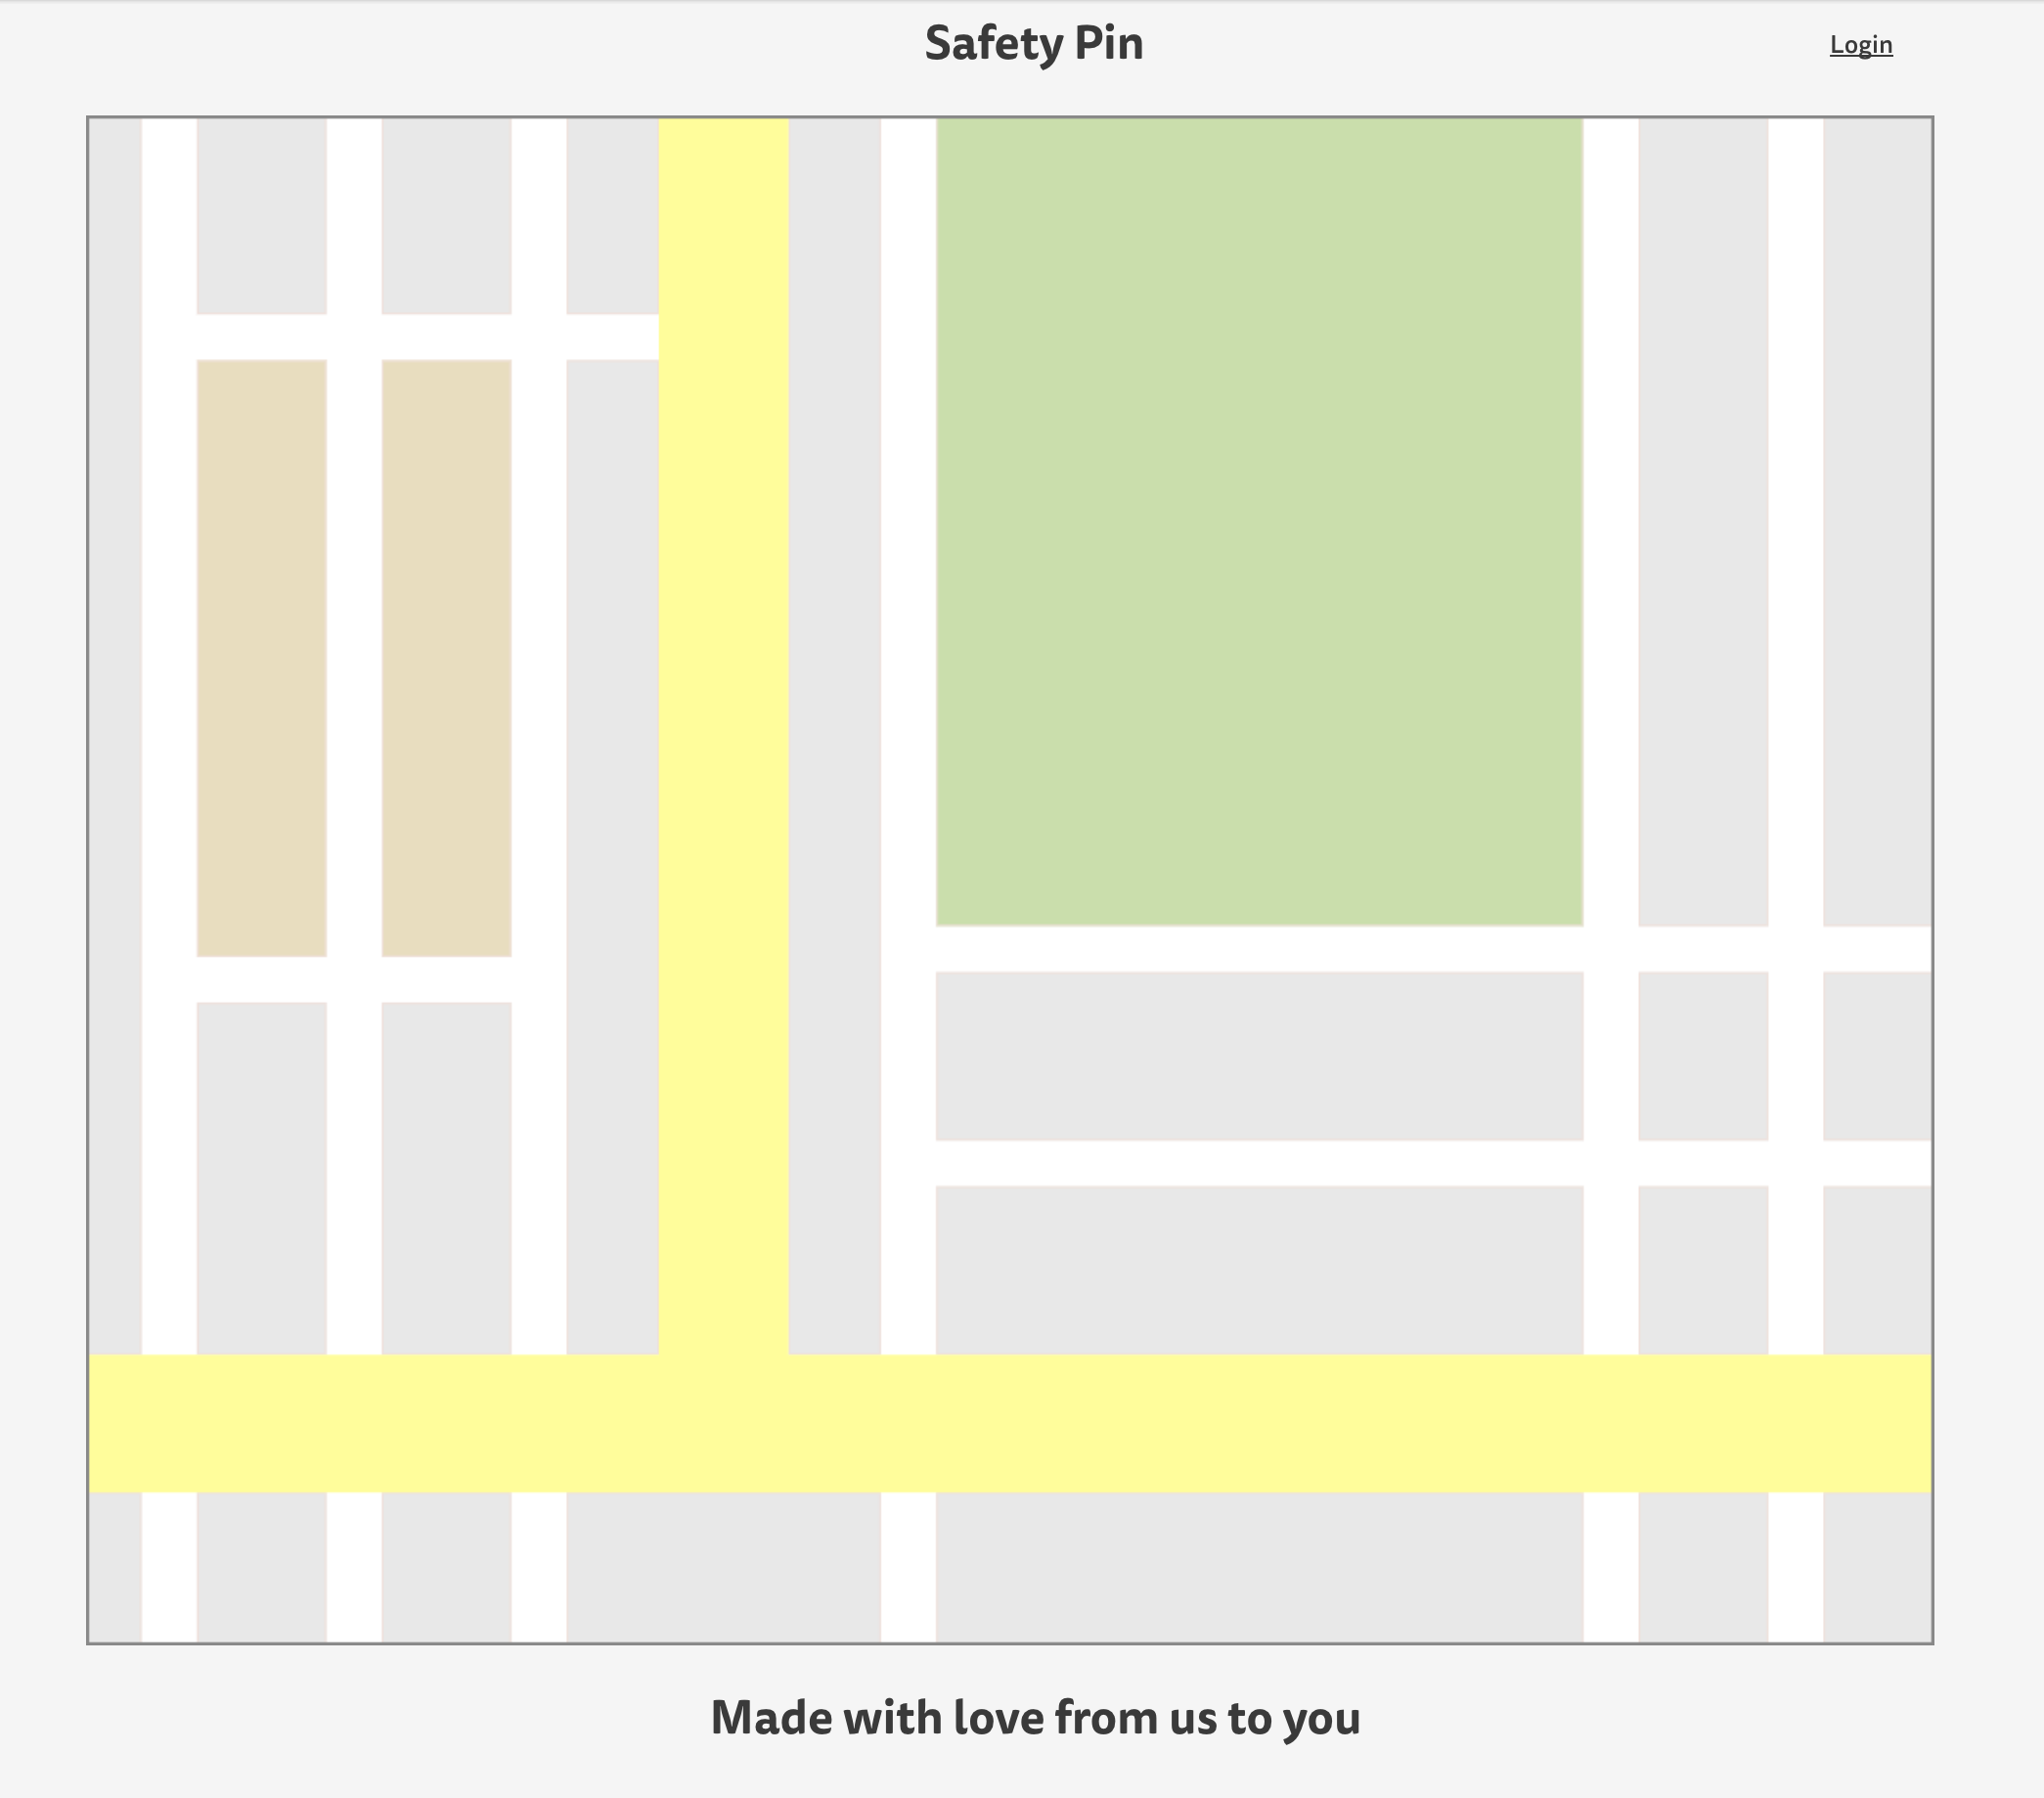
Visually provides users with crime data based on location, for the Seattle area.
Teammates:
Mark-Woo: https://m-woo.github.io/
Nic Vogt: https://vogtn.github.io/portfolio/
React, Node/Express, React-router, Mongodb, Materialize-UI, Webpack
We started out by creating a basic Oauth implimentation using Express, Passport, and JWT to satsify the requirements of the project. At this point we decided to utilize google's Materialize-UI which worked well with react to help us develop user inputs for login.
Once login was finished, gathering the data was our main point of concern. We knew that there was an accessable API through Socrata to retrieve crime statistics, however, the documentation was pretty poor and we weren't getting the data with location association.
Since we were primarily setting markers on a google map, we specifically needed lattitude and longitude data points associated with each crime. That eventually led to us to reasearching to find an api endpoint for this data. After we managed to find an endpoint someone used in the past, we simply had to render the map along with our data.
For the google maps render we used two modules, 'react-google-map' and 'react-google-maps-loader'. This made it easier for us to handle simply passing the crime data through to rendering the map.
The next major issue was manipulating the data, since the API gives us a specific format and the google maps marker only accepts a specific format. Each marker had to be loaded into google maps in an array of objects in this format (warning: this was a 'joke' marker to show of an example during our presentation):
  {
  title: 'Jackyson',
  position: {
    lat: 47.6074,
    lng: -122.3430,
  },
  onLoaded: (googleMaps, map, marker) => {
    // Set Marker animation
    marker.setAnimation(googleMaps.Animation.DROP)
    // Define Marker InfoWindow
    const infoWindow = new googleMaps.InfoWindow({
      content: `
        <div>
          <h6 id='blockLocation'>`+ '1483 Alaskan Way, Seattle, WA 98101' +`<h6>
          <p id='offense'>` +
            'JACKSON-DUHON--TOUCHING FISH INNAPPROPRIATELY'
            +
          `</p>
        </div>
      `,
    })
    // Open InfoWindow when Marker will be clicked
    googleMaps.event.addListener(marker, "click", () => {
      infoWindow.open(map, marker)
    })
  },
}
The way that we managed to manipulate our api data call into hundreds of markers was through a map:
var newData = data.map(element =>{
          return(
              {
                title: element.offense_type,
                position: {
                  lat: element.location.coordinates[1],
                  lng:  element.location.coordinates[0],
                },
                onLoaded: (googleMaps, map, marker) => {
                  // Set Marker animation
                  marker.setAnimation(googleMaps.Animation.DROP)

                  // Define Marker InfoWindow
                  const infoWindow = new googleMaps.InfoWindow({
                    content: `
                      <div>
                        <h6 id='blockLocation'>`+ element.hundred_block_location +`<h6>
                        <p id='offense'>` +
                          element.offense_type
                          +
                        `</p>
                      </div>
                    `,
                  })

                  // Open InfoWindow when Marker will be clicked
                  googleMaps.event.addListener(marker, "click", () => {
                    infoWindow.open(map, marker)
                  })
                },
              }
          )
- Further seperation of component logic
- Finding more crime data points
- Adding route path
- Displaying data points in a heat map
