- Car Evaluation for different features becomes an important tool for recommendation to the users as per their requirements, and needs to be designed as a tool that can help in developing closer relationships between the automobile industry and its customers.
- It is useful in identifying cusotmer bases and loyalties as well as can be used for customer segmentation as per needs and income classes.
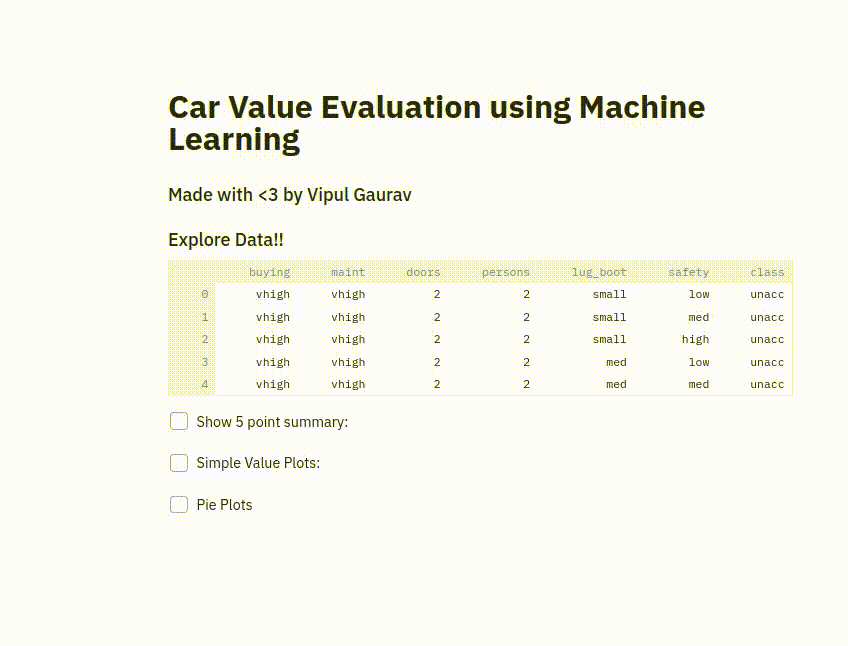
- The data contains 1728 rows and 7 columns with descriptions as follows:
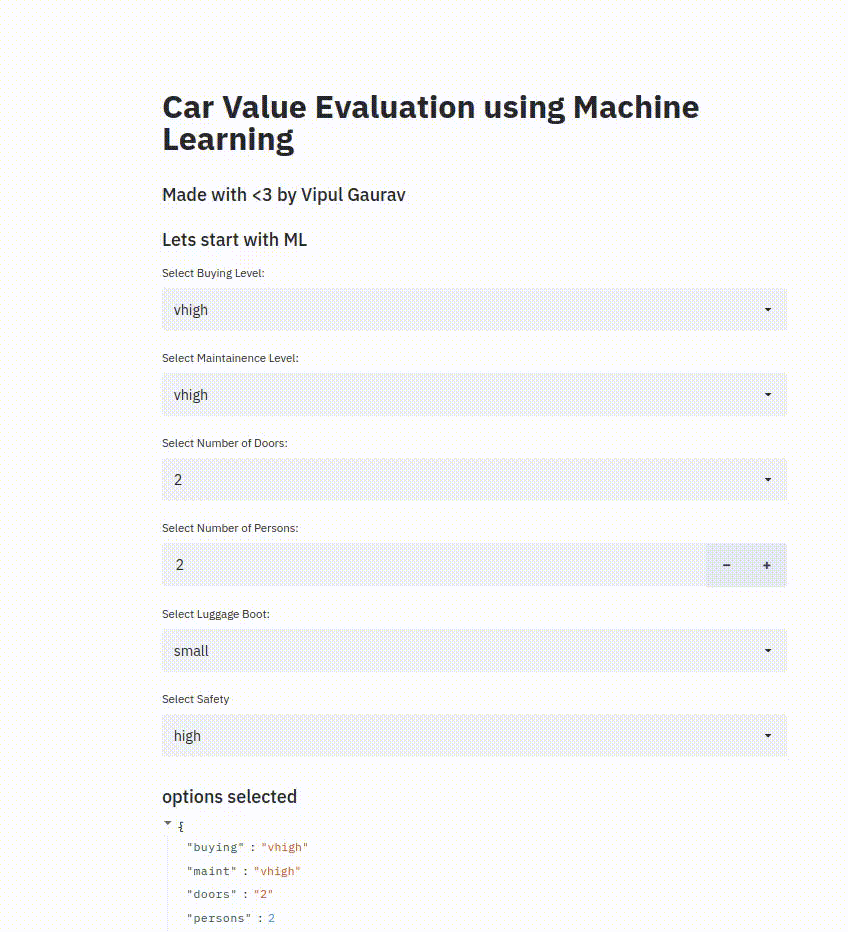
- buying: Buying Level or Capacity of the customer (Very High:vhigh, High:high, Low:low, Medium:med)
- maint: Maintainence Level (Very High:vhigh, High:high, Low:low, Medium:med)
- doors: Number of doors in the car (2, 3, 4 and 5 or more)
- lug_boot: Luggage Boot Size in the car (small, med, big)
- safety: Safety Level of Car (high, med, low)
- class: Unacceptable, Acceptable, VeryGood, Good
- The data is a classic multi-class classification task with multiple classes of cars available as the final evaluation
- The data does not have any missing values
- The data does not have repetitive columns
- The data is fully categorical with even the final target variable is also in form of a category
- Label Encoding and mapping is used to make continous labels for the majorly ordinal data
- Random Forest Classifier tuned with Synthetic Minority Oversampling Technique or SMOTE is used to balance the classes as per need.
- The bias in model is removed and boosts the accuracy to over 96% percent
- Grid Search is performed to tune up with Random Forest to determine suitable number of estimators.
- Logistic Regression fails to converge to a good solution with 81 percent accuracy.
- MLP Classifier also converges to a less good solution
- Decision tree is successful with minimum 10-11 estimators, and fails on over 12 estimators.
- Accuracy Score is chosen as the evaluation metric
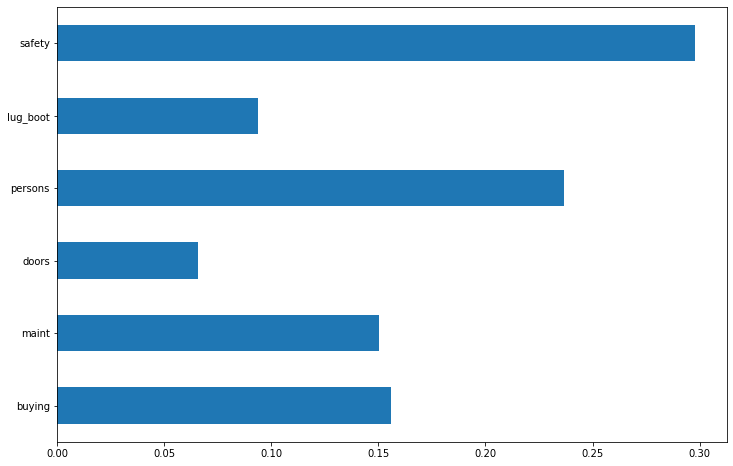
- The feature importances for the dataset is as follows with respect to Random Forest Model at 96.5% accuracy:
-
The app is deployed as a Streamlit Web Application with the following options:
- Exploratory Data Analysis:
- 5 point summary
- Countplot of classes
- Column Selection
- Prediction:
- Logistic Regression
- MLP Classifier
- Random Forest Classifier
- Custom Data Entry
- Exploratory Data Analysis:
-
To run the web app follow the instructions:
git clone <repo-URL>
streamlit run app.py- It is also deployed on Heroku for a while at Link