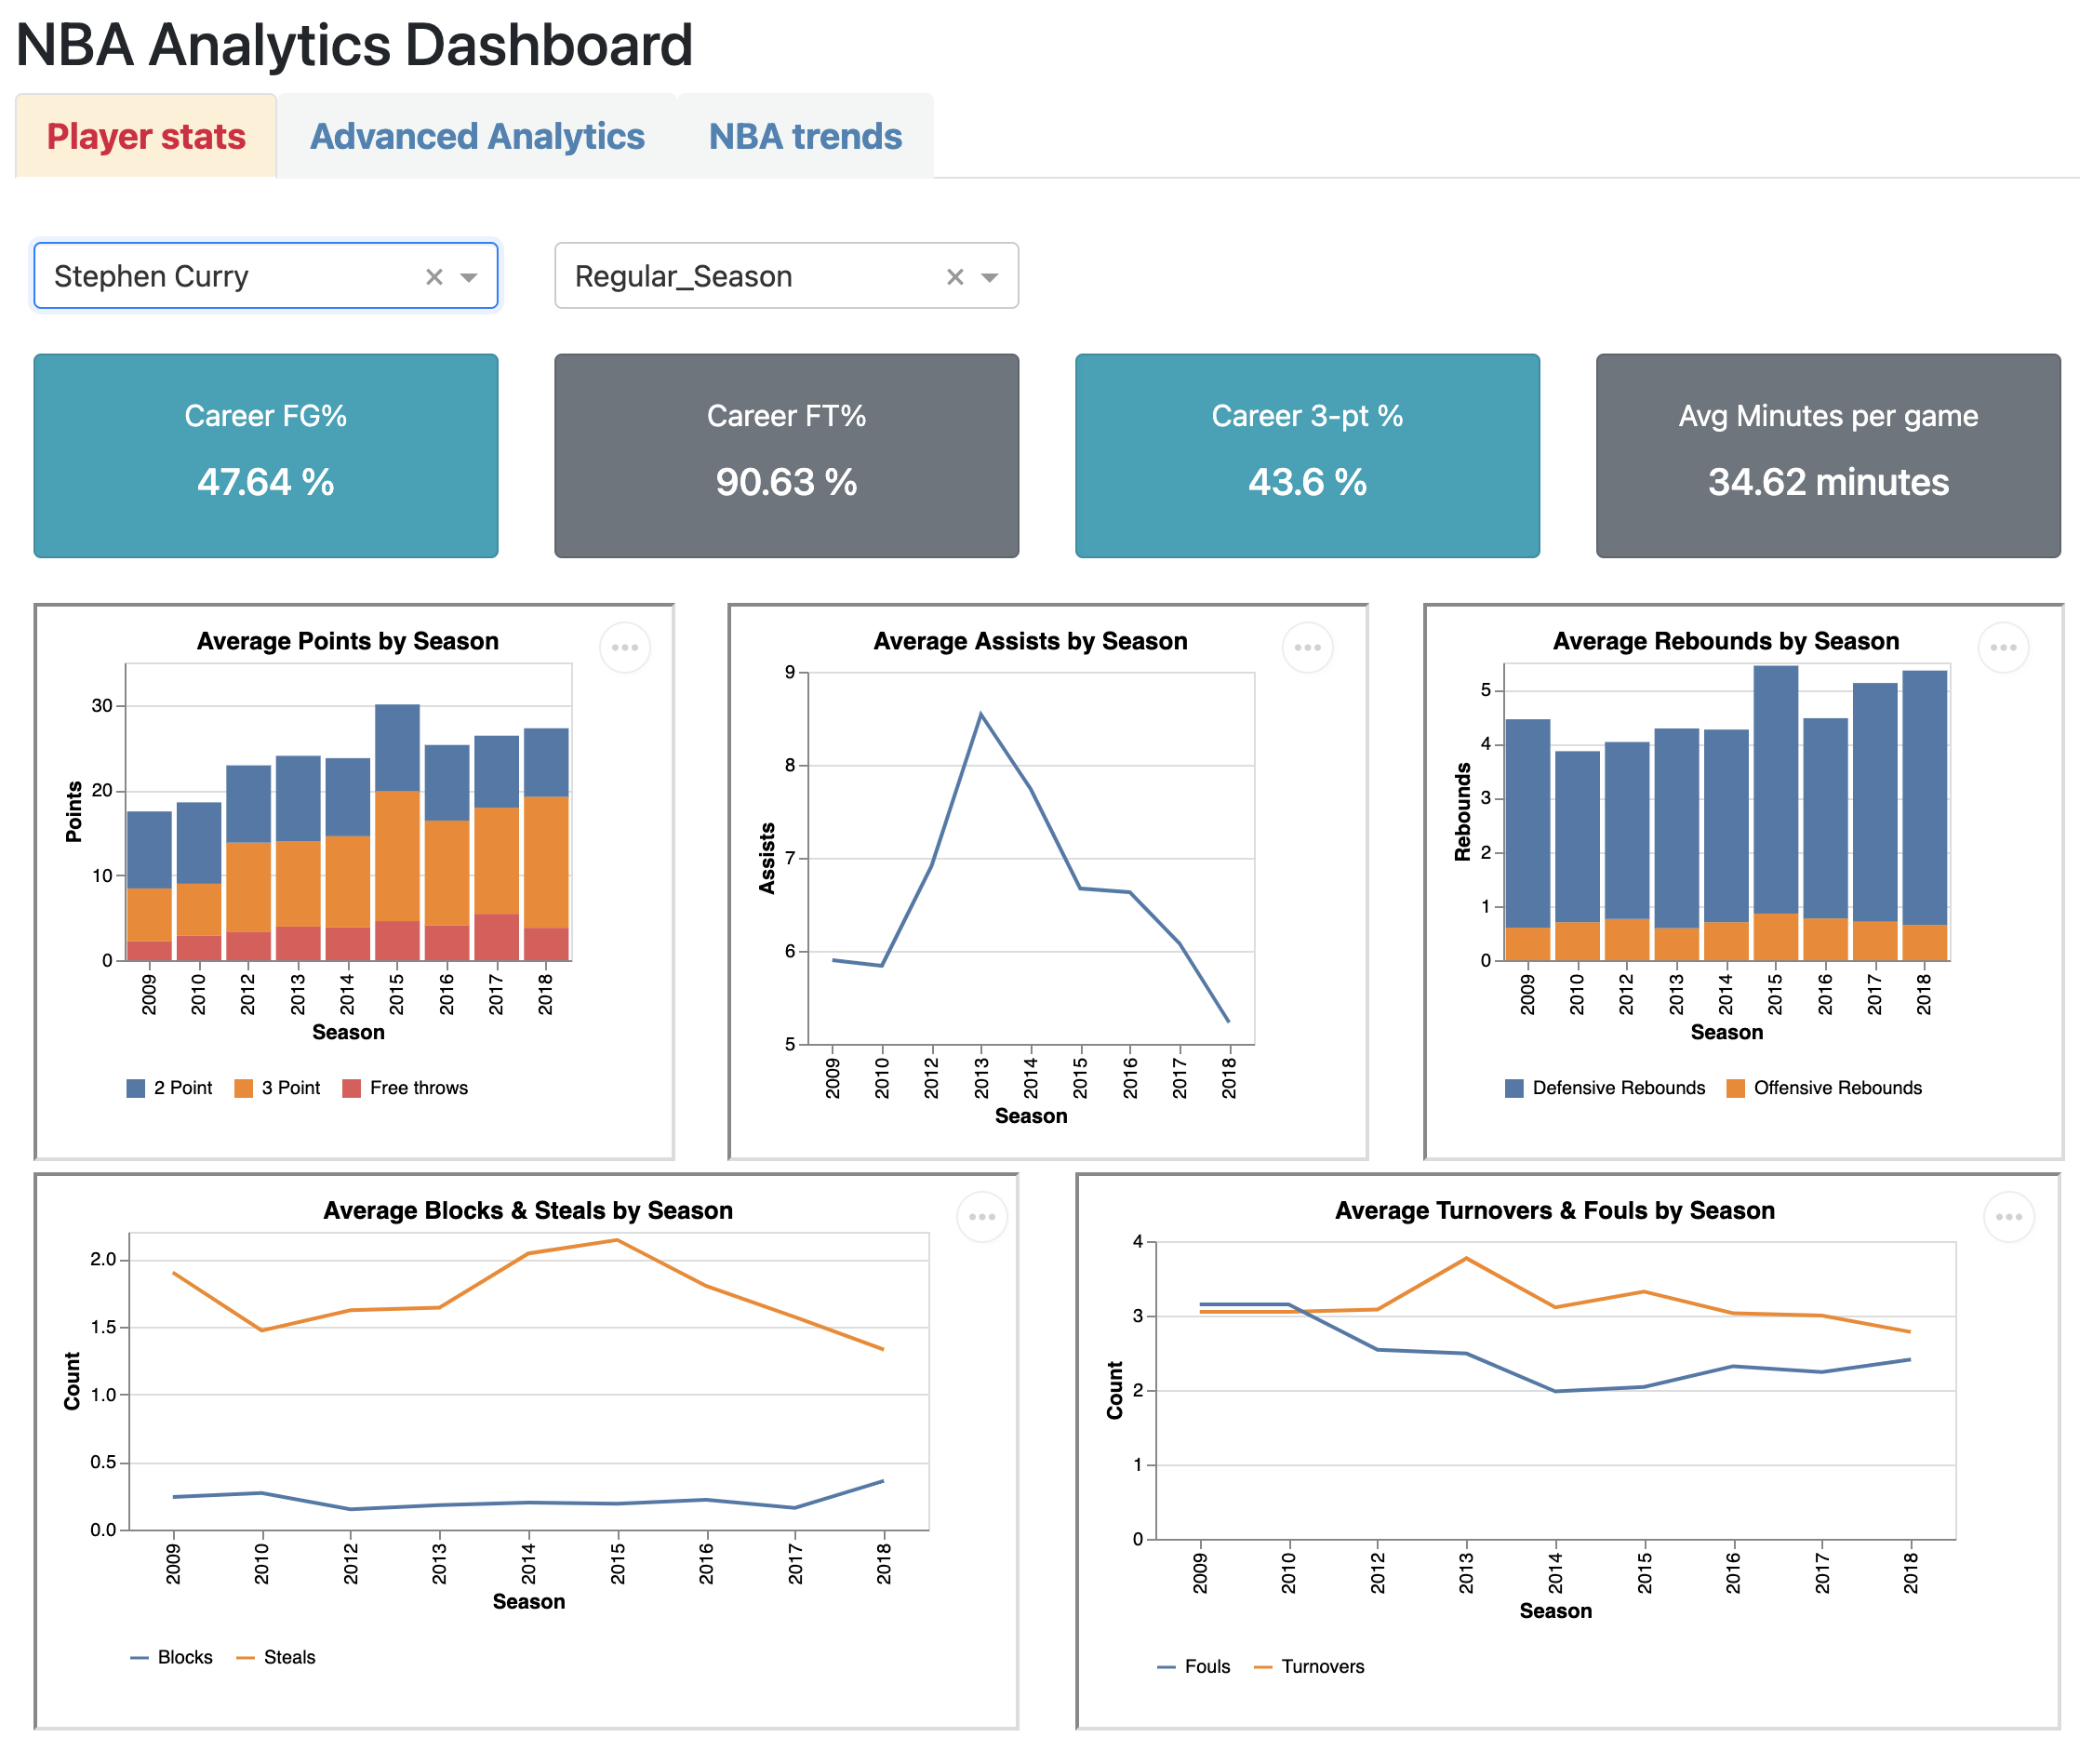
This NBA Analytics dashboard enables the users to analyze player statistics as well as trends in the NBA. The metrics and visualizations in this dashboard are divided into three different sections (tabs).
-
First tab contains Individual player statistics. Key performance indicators are presented in numerical format on top, followed by different charts that show performance metrics of the player over time. For example, users will be able to look at 'Field Goal %', 'Average Points per game', 'Rebounds', 'Assists' for any NBA player in the past 20 years. Users will have the ability to select a player through a dropdown and/or select NBA season(s) with the help of a slider.
-
Second tab presents advanced player performance indicators that are derived from the manipulation of the existing data. Metrics such as 'Offensive Efficiency Rating', '% of shot attempts that are 3-pointers', 'performance against player age' are visualized in line graphs and bar charts in this section. Users will have the ability to select a player through a dropdown and/or select NBA season(s) with the help of a slider. These advanced statistics help NBA analysts, managers, and scouts identify factors and key performance indicators that lead to team success.
-
Third tab contains visualizations that exhibit overall statistical trends over time in the NBA. This tab helps users analyze how the game has evolved in terms of offensive and defensive statistical indicators. Line charts and bar graphs in this section demonstrate the progression of the game over time in terms of 3 pointers, rebounds, assists, steals, and reliance of teams on their star players. Users will also be able to look at differences between teams that make playoffs and teams that do not. Stats based on draft position may also be included if time permits.
Dashboard app can be found here : NBA Analytics Heroku R App. The code for the app is in the main branch of this repository as app.R.
