Data Source • Findings • Technology Used
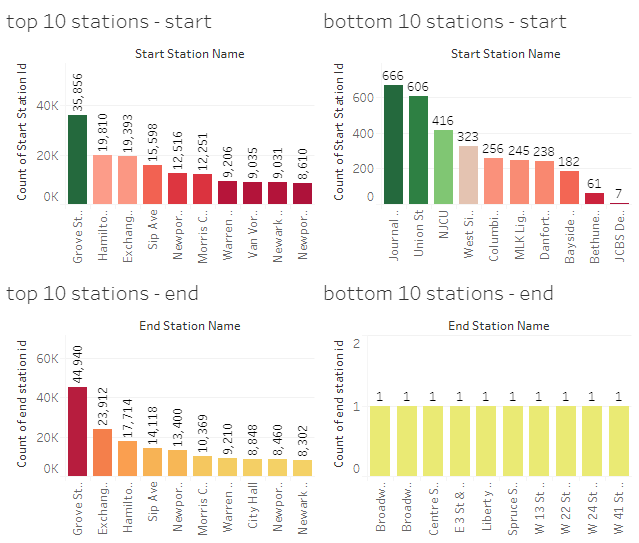
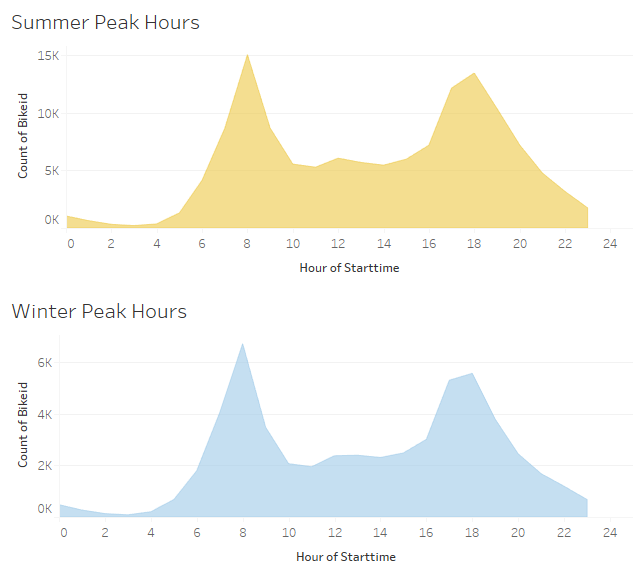
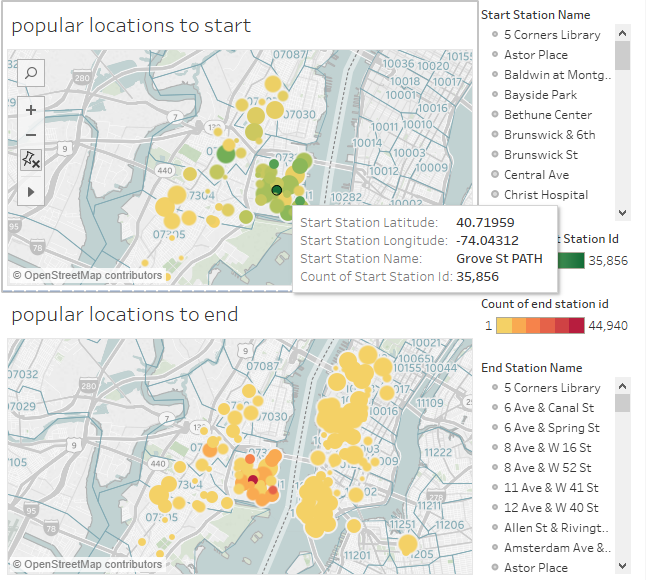
An analysis of the New York Citi's Bike Program which is responsible for overseeing the largest bike sharing program for 200,000+ data points in the United States in order to generate business insights through visualization of the peak time in both summer and winter period and the top start location in New York City and Jersey City, New Jersey
- Click here to view completed dashboard
This Citi Bike Data has been processed to remove trips that are taken by staff as they service and inspect the system and any trips that were below 60 seconds in length (potentially false starts or users trying to re-dock a bike to ensure it's secure).
| Name | Date Modified | Size | Type |
|---|---|---|---|
| JC-201701-citibike-tripdata.csv.zip | Apr 6th 2017, 02:01:43 pm | 255 KB | ZIP file |
| JC-201702-citibike-tripdata.csv.zip | Apr 6th 2017, 02:01:44 pm | 275 KB | ZIP file |
| JC-201703-citibike-tripdata.csv.zip | Apr 6th 2017, 02:01:44 pm | 241 KB | ZIP file |
| JC-201704-citibike-tripdata.csv.zip | Aug 1st 2017, 09:20:54 am | 432 KB | ZIP file |
| JC-201705-citibike-tripdata.csv.zip | Aug 1st 2017, 09:20:55 am | 529 KB | ZIP file |
| JC-201706-citibike-tripdata.csv.zip | Aug 1st 2017, 09:20:56 am | 647 KB | ZIP file |
| JC-201707-citibike-tripdata.csv.zip | Aug 1st 2017, 09:20:57 am | 676 KB | ZIP file |
| JC-201708 citibike-tripdata.csv.zip | Oct 3rd 2017, 08:52:49 am | 711 KB | ZIP file |
| JC-201709-citibike-tripdata.csv.zip | Oct 3rd 2017, 08:52:49 am | 667 KB | ZIP file |
| JC-201710-citibike-tripdata.csv.zip | Jan 31st 2018, 01:15:18 pm | 703 KB | ZIP file |
| JC-201711-citibike-tripdata.csv.zip | Jan 31st 2018, 01:15:19 pm | 477 KB | ZIP file |
| JC-201712-citibike-tripdata.csv.zip | Jan 31st 2018, 01:15:19 pm | 324 KB | ZIP file |
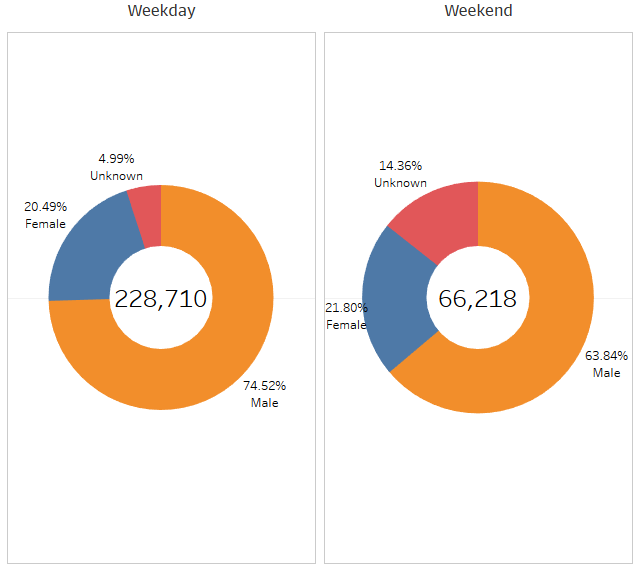
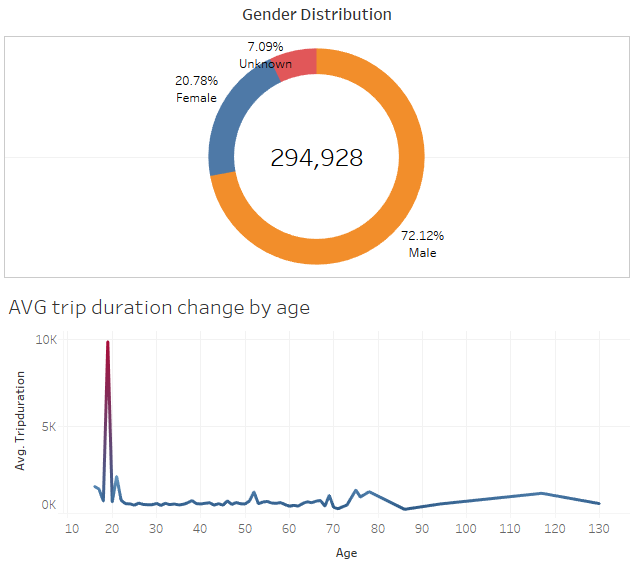
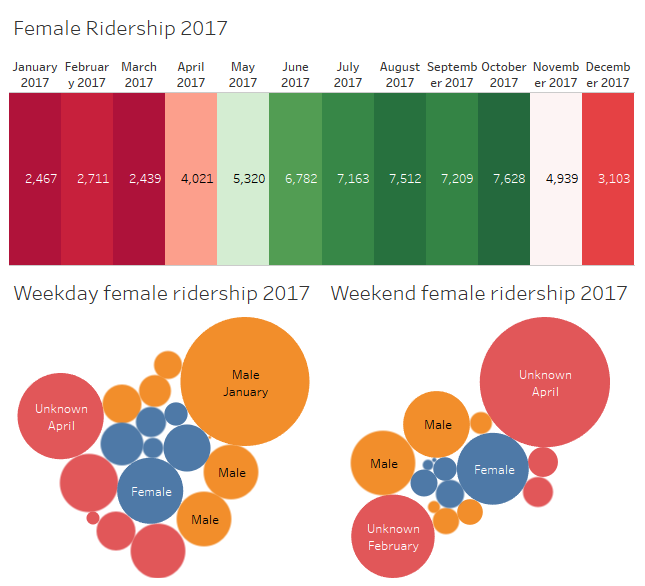
- Limitation There were 7% user did not provide gender information and most of them (14%) are weekend users so we will not be able to tell if female are more willing to ride on the weekend then they do on weekdays, but we may still determine that male user are the dominant customer at all time
(1) The current major citi bike riders fall into young male group between 18 -20 but number of femal reiders increases over time as they are showing interest to start riding during the weekend
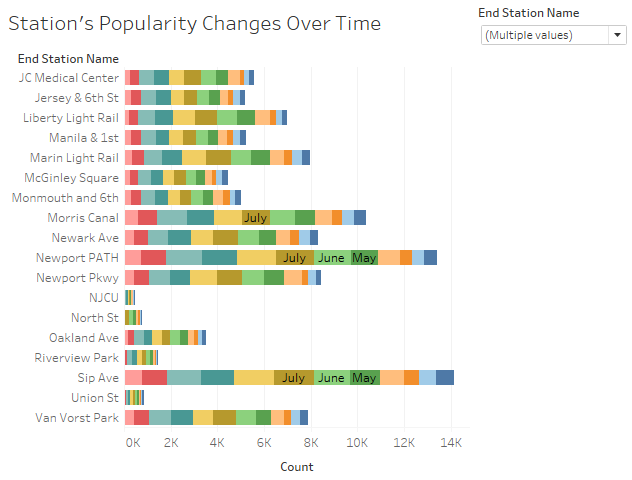
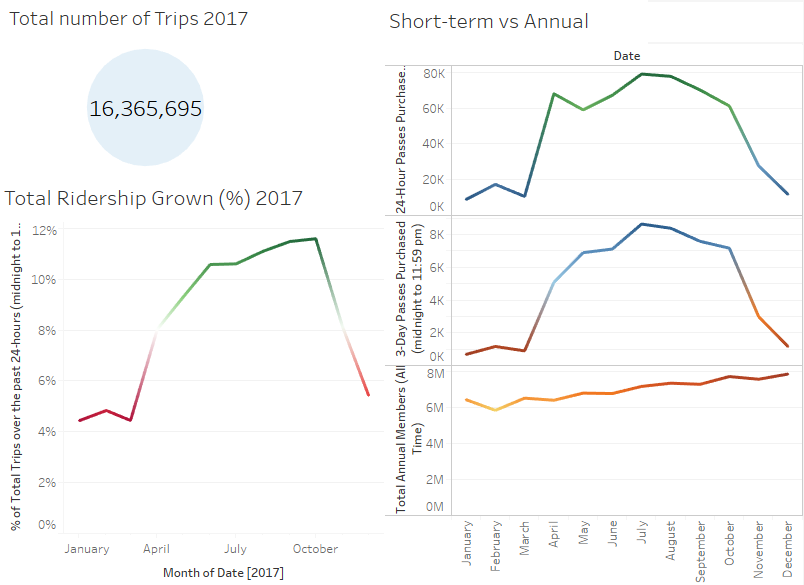
(3) As the temperature gets cold as winter begins, people tend not to ride as well because of the lack of comfort individuals face when riding in low temperatures. Therefore, at some point the ridership does not grow. However, the total amount of annual member have been kept increased over time in 2017
- More and more people choose to live in Jersey City and work in Manhathan

