In this Code Pattern, we will Generate Insights by integrating data from multiple data sources like Db2 On Cloud, CSV File, Db2 Warehouse, etc using Watson Studio. Telling a story with data usually involves integrating data from multiple sources. Being able to combine data from multiple sources is essential when performing analysis. Here we worked with a few data sources namely Db2 On Cloud, CSV File and Db2 Warehouse, but the power of Watson Studio is that this technique can be applied to other sources like MySQL databases, IBM Db2 Big SQL, Oracle database, PostgreSQL, Microsoft SQL Server, and many more, no matter the dataset size.
In this pattern, we will demonstrate the methodology with the following usecase. A watch manufacturing company XYZ manufactures five types of watchs, in three different branch locations (Manchester, Glasgow and Madrid) which uses different selling methods (Telephone, Visiting the Store and Online method). The sales data for each of these branches are stored in a different data source ( Db2 on Cloud, Db2 Warehouse and csv files ). We will integrate data from all these sources and put it on a single data source (Db2 warehouse). This integrated data will further be used to derive insights and will be visualized on an embedded dashboard. This will help us in interpreting, which product is performing the best and which branch is performing the best.
When the reader has completed this Code Pattern, they will understand how to:
- Connect and get data from multiple data sources.
- Integrate data from multiple data sources.
- Send integrated data to the Db2 Warehouse.
- Derive insights and visualize on Watson Embedded Dashboard.

- Extract data from local files (csv file).
- Extract data from Db2 on cloud.
- Integrate the data in Watson Studio.
- Send the data to Db2 Warehouse.
- Visualize and derive insights using Embedded dashboard.
- IBM Cloud account: Create an IBM Cloud account.
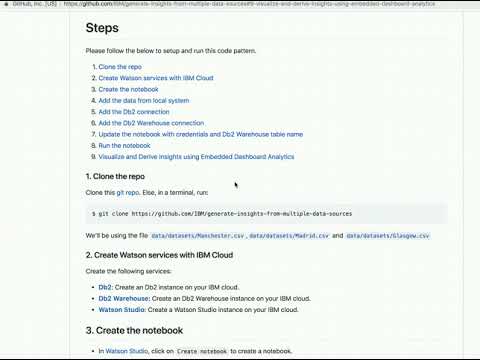
Please follow the below to setup and run this code pattern.
-
Update the notebook with credentials and Db2 Warehouse table name
-
Visualize and Derive Insights using Embedded Dashboard Analytics
Clone this git repo. Else, in a terminal, run:
$ git clone https://github.com/IBM/generate-insights-from-multiple-data-sources.git
We’ll be using the file data/datasets/Manchester.csv,data/datasets/Madrid.csv and data/datasets/Glasgow.csv
Create the following services:
- Db2 on Cloud: Create an Db2 instance on your IBM cloud.
NOTE: Starting September 30, 2019, you will not be able to provision new instances of the Db2 Warehouse on Cloud Entry plan.

Alternate for IBM Cloud Entry plan users:

* Use the Db2 on Cloud instace that you created just now, instead of Db2 Warehouse.
- Db2 Warehouse: Create an Db2 Warehouse instance on your IBM cloud.
- Watson Studio: Create a Watson Studio instance on your IBM cloud.
- In Watson Studio, click on
Create notebookto create a notebook. - Create a project if necessary, provisioning an object storage service if required.
- In the
Assetstab, select theCreate notebookoption and selectStandardoption. - Select the
From URLtab. - Enter a name for the notebook.
- Optionally, enter a description for the notebook.
- Enter this Notebook URL: https://github.com/IBM/generate-insights-from-multiple-data-sources/blob/master/notebook/project.ipynb
- Select the free Anaconda runtime.
- Click the
Createbutton.
- When you clone this repo, you will find three
.csvfiles indata/datasets/. - From your project page in Watson Studio, click
Find and Add Data(look for the10/01icon) and itsFilestab. - Click
Browseand navigate todata/datasets/and findManchester.csvon your computer. - Add the file to Object storage.

- Launch your Db2 on cloud and click on
Load, as shown below.

- Click on
browse filesand uploadMadrid.csv, as shown below.

- Choose the default schema and create a table
MADRID, as shown below.

- Now click on next and load the data.

- Make sure you note down the table name. In my case the table name is
TZF04421.MADRID.
- In your project, click
Add to projectand then selectConnectiontab, as shown below.

- It will redirect you to
new connectionpage. Here chooseDb2 on Cloud, as shown below.

- Fill in your
username, password, hostname and Database. Leaveuse a secure gatewayunchecked.

NOTE: You can get username, password, hostname and Database credentials by creating/clicking New Credentials from your Db2 service instance on cloud, as shown below.

NOTE: Starting September 30, 2019, you will not be able to provision new instances of the Db2 Warehouse on Cloud Entry plan.

Alternate for IBM Cloud Entry plan users:

* Use the same 'Db2 on Cloud' instace that you created and follow the steps below,
This methodology is similar to step 5.
-
Launch your Db2 and click on
Load. -
Click on
Browse filesand uploadGlasgow.csv. -
Choose the default schema and create a table
GLASGOW. -
Now click on next and load the data.
-
Make sure you note down the table name. In my case the table name is
DASH5989.ALL.
-
In your project, click
Add to projectand then selectConnectiontab. -
It will redirect you to
New connectionpage. Here chooseDb2 Warehouse. -
Fill in your
username, password, hostname and Database. LeaveUse a secure gatewayunchecked. -
NOTE: You can get username, password, hostname and Database credentials by creating/clicking New Credentials from your Db2 Warehouse service instance on cloud.
- Select the cell below
2.2 Add the data from local system (csv file)section in the notebook to update the credentials for Object Store. - Use
Find and Add Data(look for the10/01icon) and itsFilestab. You should see the file names uploaded earlier. Make sure your active cell is the empty one created earlier. - Select
Insert to codebelowManchester.csv. - Click
Insert Pandas DataFramefrom the drop down menu.

- After inserting, make sure you change the DataFrame name to
df1, as shown below.NOTE: This step is very important.

- Select the cell below
2.3 Add the data from Db2 and Db2 Warehousesection in the notebook to update the connection credentials for Db2. - Use
Find and Add Data(look for the10/01icon) and itsConnectionstab. You should see the Db2 name which we earlier connected. Make sure your active cell is the empty one created earlier. - Select
Insert to codebelowDb2. - Click
Insert Pandas DataFramefrom the drop down menu. - Select the schema in which you created the table.
- Select
MADRIDtable.

- After inserting, make sure you change the DataFrame name to
df2, as shown below.NOTE: This step is very important.

- Select the cell below
2.3 Add the data from Db2 and Db2 Warehouse2section in the notebook to update the connection credentials for Db2 Warehouse. - Use
Find and Add Data(look for the10/01icon) and itsConnectionstab. You should see the Db2 Warehouse name which we earlier connected. Make sure your active cell is the empty one created earlier. - Select
Insert to codebelowDb2 Warehouse. - Click
Insert Pandas DataFramefrom the drop down menu. - Select the schema in which you created the table.
- Select
GLASGOWtable. - After inserting, make sure you change the DataFrame name to
df3.NOTE: This step is very important.
- Select the cell below
2.5 Configure to the Db2 Warehousesection in the notebook to update the connection credentials for Db2 Warehouse. - Use
Find and Add Data(look for the10/01icon) and itsConnectionstab. You should see the Db2 Warehouse name which we earlier connected. Make sure your active cell is the empty one created earlier. - Select
Insert to codebelowDb2 Warehouse. - Click
Insert Credentialsfrom the drop down menu. - If the credentials are written as
credential_2change them tocredentials_1. Make sure that the credentials name iscredentials_1.NOTE: This step is very important.

- Make sure you change the schema name
DASHXXXXXas shown below in step 3 from the notebook, with the username of your Db2 Warehouse(In capital letters).

When a notebook is executed, what is actually happening is that each code cell in the notebook is executed, in order, from top to bottom.
Each code cell is selectable and is preceded by a tag in the left margin. The tag
format is In [x]:. Depending on the state of the notebook, the x can be:
- A
blank, this indicates that the cell has never been executed. - A
number, this number represents the relative order this code step was executed. - A
*, this indicates that the cell is currently executing.
There are several ways to execute the code cells in your notebook:
- One cell at a time.
- Select the cell, and then press the
Playbutton in the toolbar.
- Select the cell, and then press the
- Batch mode, in sequential order.
- From the
Cellmenu bar, there are several options available. For example, you canRun Allcells in your notebook, or you canRun All Below, that will start executing from the first cell under the currently selected cell, and then continue executing all cells that follow.
- From the
- At a scheduled time.
- Press the
Schedulebutton located in the top right section of your notebook panel. Here you can schedule your notebook to be executed once at some future time, or repeatedly at your specified interval.
- Press the
For this Notebook, you can simply Run All cells.
- A table will be created on Db2 Warehouse, after you run this python file
- In my case the table created in Db2 Warehouse is
DASH5989.ALL. - Go to your Db2 warehouse and check for a file with table name
ALLin default schema. - Now the data is ready for visualisation.
IBM® Cognos Dashboard Embedded is a new, API-based solution that lets developers easily add end-to-end data visualization capabilities to their applications so users can create visualizations that feel like part of the app. In this pattern we have used this service to consume the derived insights(from db2 warehouse) followed by interactive dashboards which produces visualizations directly from your data in real-time.
- Live connection to underlying data
- Interactive dashboards produce visualizations directly from your data in real-time.
- Smart creation of visualizations
- Smart data analysis and visualization capabilities help users discover underlying patterns and meanings in their data.
- Interactive exploration of data
- Data can be explored using filtering and navigation paths.
- Embedded in your application
- Because dashboards are fully embedded, dashboards are integrated into your application's context, keeping users engaged.
- Click on
Add to Projectbutton to add the Embedded Dashboard Analytics service.

- Create the New Embedded Dashboard service or if you already have one then from the drop down prompt, select the
Dashboard Embedded servicefrom the list. And click onSavebutton in the bottom.

- Select the Template for your Dashboard.

- Click on selected sources
+button to connect to the DB2 Warehouse.

- Connect to the DB2 Warehouse database (DASH5989). See below screenshot for details.

- After connecting to the DB2 Warehouse database, you will see
Allas a new datasource under the Selected Sources.

- Click on
Alldata source and now you can see the column names displayed vertically underAll. These columns can be used for dashboard as a source.

We will create 2 tabs (Gross Profit and Revenue Analysis & Unit Sold Analysis).
Under Gross Profit and Revenue Analysis tab, we would create 6 widgets.
- Gross Profit analysis by year widget
- Gross Profit analysis by Store Location widget
- Revenue Generated by Order Method
- Revenue Generated by Store Location
- Gross Profit Analysis by Order Method
- Types of Watches sold Analysis by Order Method
- To create this widget, firstly click on the visualizations icon and select and drag the
Word Cloudchart to the dashboard pane. See below screenshot for details.

- Add
Store LocationandGross Profitto theWord CloudChart. See screenshot for details.

- Add
Store LocationandOrder Methodto theBar chart. See screenshot for details.

- Add
Store LocationandRevenue Generatedto theTree Mapchart. See screenshot for details.

- This dashboard once completed with required visualizations can now be shared by clicking on the share url icon to copy the url. See below screenshot for details.

- Copy the url and you can share to anyone whom you think is relevant. See below screenshot for details.

With the help of the above basic steps to build the widgets(charts), one would be able to build desired charts to find valuable insights from multiple data sources. Also, with the interactive dashboards which produces visualizations directly from your data in real-time, one can slice and dice data from various perspectives. For example, the dashboard that we built can view Gross Profit analysis by year, Gross Profit analysis by Store Location, Revenue Generated by Order Method all in the form of charts.This will help us in interpreting, which product is performing the best and which branch is performing the best. Also, this dashboard service now gives the complete insights of the data which is a merge of multiple data sources.
Gross Profit Analysis sample output of the dashboard.

- Unit Sold Analysis sample output of the dashboard.

Refer to Troubleshooting.