Metaissue for Visual Studio debugging Rust #40460
Comments
|
There was some previous work trying to use natvis: #36503 Notably, the following natvis code enables the VS "Text Visualizer" for strings, using the correct UTF-8 encoding (at least this worked in VS 2015): <Type Name="collections::string::String">
<DisplayString>{vec.buf.ptr.pointer.__0, [vec.len]s8}</DisplayString>
<StringView>vec.buf.ptr.pointer.__0, [vec.len]s8</StringView>
</Type> |
|
@Boddlnagg - I noticed that only works if you have patched s8 support? I tried just copying/pasting your example with out and wasn't able to get it to work. I also noticed that #39843 is related to the natvis work. |
|
@jonathandturner I did not patch s8 support (I don't even know what you mean by that) ... but I had to manually work around #36646 by patching the type information in the PDB. I'd also like to point out that #36503 (comment) explains the ability to embed natvis files into PDBs (maybe |
|
I think that if it is possible, conditional breakpoints would be a nice addition. |
|
rustc/cargo don't copy the .pdb file to the directory of the executable automatically anymore, is that a decision/design of rustc/cargo? IIRC rustc 1.13 will copy the .pdb file. |
|
@mzji The |
|
@retep998 So if the debugger failed to load the .pdb files automatically, does that means there is a bug in the debugger? Here is the log when I try to debug my new project with x64dbg: After failed loading from the symbol cache, x64dbg just tries to load the file from the working directory of the executable. And the |
|
@mzji I think VS loads the PDB, but in VS Code I had to change the launch configuration to run the executable from the |
|
@lnicola Then I think we should at least leave a copy in the directory of binaries, since different debuggers do different things (VS will find and load pdb files automatically, VS Code/Ollydbg/x64dbg and all debuggers which is only using |
|
Back to the original issues, the most 2 annoying things that happen when I try to debug Servo is that:
|
|
@codec-abc - by chance, have you tried using the natvis from this PR to see if it helps with your second bullet point? #39843 I've been chatting with the author and would like to potentially make it part of the pdb at some point. |
|
I used the one in the opening message of the issue. So they are probably different. Edit : Damned the "good" one was just a few characters away. How stupid I am. |
|
@codec-abc - yeah, the one in the PR is much better than mine, with support for more common Rust std lib structures. |
|
…erister
Embed MSVC .natvis files into .pdbs and mangle debuginfo for &str, *T, and [T].
No idea if these changes are reasonable - please feel free to suggest changes/rewrites. And these are some of my first real commits to any rust codebase - *don't* be gentle, and nitpick away, I need to learn! ;)
### Overview
Embedding `.natvis` files into `.pdb`s allows MSVC (and potentially other debuggers) to automatically pick up the visualizers without having to do any additional configuration (other than to perhaps add the relevant .pdb paths to symbol search paths.)
The native debug engine for MSVC parses the type names, making various C++ish assumptions about what they mean and adding various limitations to valid type names. `&str` cannot be matched against a visualizer, but if we emit `str&` instead, it'll be recognized as a reference to a `str`, solving the problem. `[T]` is similarly problematic, but emitting `slice<T>` instead works fine as it looks like a template. I've been unable to get e.g. `slice<u32>&` to match visualizers in VS2015u3, so I've gone with `str*` and `slice<u32>*` instead.
### Possible Issues
* I'm not sure if `slice<T>` is a great mangling for `[T]` or if I should worry about name collisions.
* I'm not sure if `linker.rs` is the right place to be enumerating natvis files.
* I'm not sure if these type name mangling changes should actually be MSVC specific. I recall seeing gdb visualizer tests that might be broken if made more general? I'm hesitant to mess with them without a gdb install. But perhaps I'm just wracking up technical debt.
Should I try `pacman -S mingw-w64-x86_64-gdb` and to make things consistent?
* I haven't touched `const` / `mut` yet, and I'm worried MSVC might trip up on `mut` or their placement.
* I may like terse oneliners too much.
* I don't know if there's broader implications for messing with debug type names here.
* I may have been mistaken about bellow test failures being ignorable / unrelated to this changelist.
### Test Failures on `x86_64-pc-windows-gnu`
```
---- [debuginfo-gdb] debuginfo-gdb\associated-types.rs stdout ----
thread '[debuginfo-gdb] debuginfo-gdb\associated-types.rs' panicked at 'gdb not available but debuginfo gdb debuginfo test requested', src\tools\compiletest\src\runtest.rs:48:16
note: Run with `RUST_BACKTRACE=1` for a backtrace.
[...identical panic causes omitted...]
---- [debuginfo-gdb] debuginfo-gdb\vec.rs stdout ----
thread '[debuginfo-gdb] debuginfo-gdb\vec.rs' panicked at 'gdb not available but debuginfo gdb debuginfo test requested', src\tools\compiletest\src\runtest.rs:48:16
```
### Relevant Issues
* #40460 Metaissue for Visual Studio debugging Rust
* #36503 Investigate natvis for improved msvc debugging
* PistonDevelopers/VisualRust#160 Debug visualization of Rust data structures
### Pretty Pictures

|
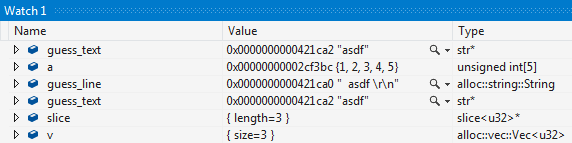
@MaulingMonkey's PR brought visualization quite a long way but there's still a few shortcomings in the debugging experience as of the latest nightly:
<Type Name="slice<*>">
<DisplayString>{{ length={length} }}</DisplayString>
<Expand>
<Item Name="[size]" ExcludeView="simple">length</Item>
<ArrayItems>
<Size>length</Size>
<ValuePointer>data_ptr</ValuePointer>
</ArrayItems>
</Expand>
</Type>
<!-- added -->
<Type Name="mut slice<*>">
<DisplayString>{{ length={length} }}</DisplayString>
<Expand>
<Item Name="[size]" ExcludeView="simple">length</Item>
<ArrayItems>
<Size>length</Size>
<ValuePointer>data_ptr</ValuePointer>
</ArrayItems>
</Expand>
</Type>
(This is VS2017, but it's the same in VS2019.) |


…r=michaelwoerister

debuginfo:  Support for std::collections::Hash* in windows debuggers.

Okay, I finally needed to debug code involving a HashMap!  Added support for HashSet s as well.

r? @michaelwoerister

### Local Testing

Verified these are passing locally:
```cmd
:: cmd.exe
python x.py test --stage 1 --build x86_64-pc-windows-msvc src/test/debuginfo
python x.py test --stage 1 --build i686-pc-windows-msvc src/test/debuginfo
python x.py test --stage 1 src/tools/tidy

:: MinGW MSYS2
./x.py test --stage 1 --build x86_64-pc-windows-gnu src/test/debuginfo
```

### Related Issues

* #36503
* #40460
* rust-gamedev/wg#20
|
There has been progress on this issue from several fronts lately:
Some additional todos/issues:
|
|
Visiting for T-compiler backlog bonanza. After discussion, we think its an anti-pattern to have an issue with an ever-growing list of features that will evolve, especially to match a debugger that is also growing new features over time. (If you want to see all the debugging issues on windows, you can use a github issue query for A-debuginfo and O-windows, or something along those lines.) So, we think the main focus of this issue should be the four points that were raised in the description (and new issues should be filed to cover new goals). As for the four points in the description, @wesleywiser says that the first three are fixed today, and believes the fourth to be fixed if you are using Visual Studio 2022. Closing. |
Recently, I started playing with the new VS 2017 Community edition. Specifically, I wanted to see if Rust debugging works with VS. Good news: out of the box, you can attach to running Rust applications compiled in debug mode, pause them, and begin debugging.
The experience isn't perfect, and I hope to grow this issue to include the places where the experience can be improved.
The text was updated successfully, but these errors were encountered: