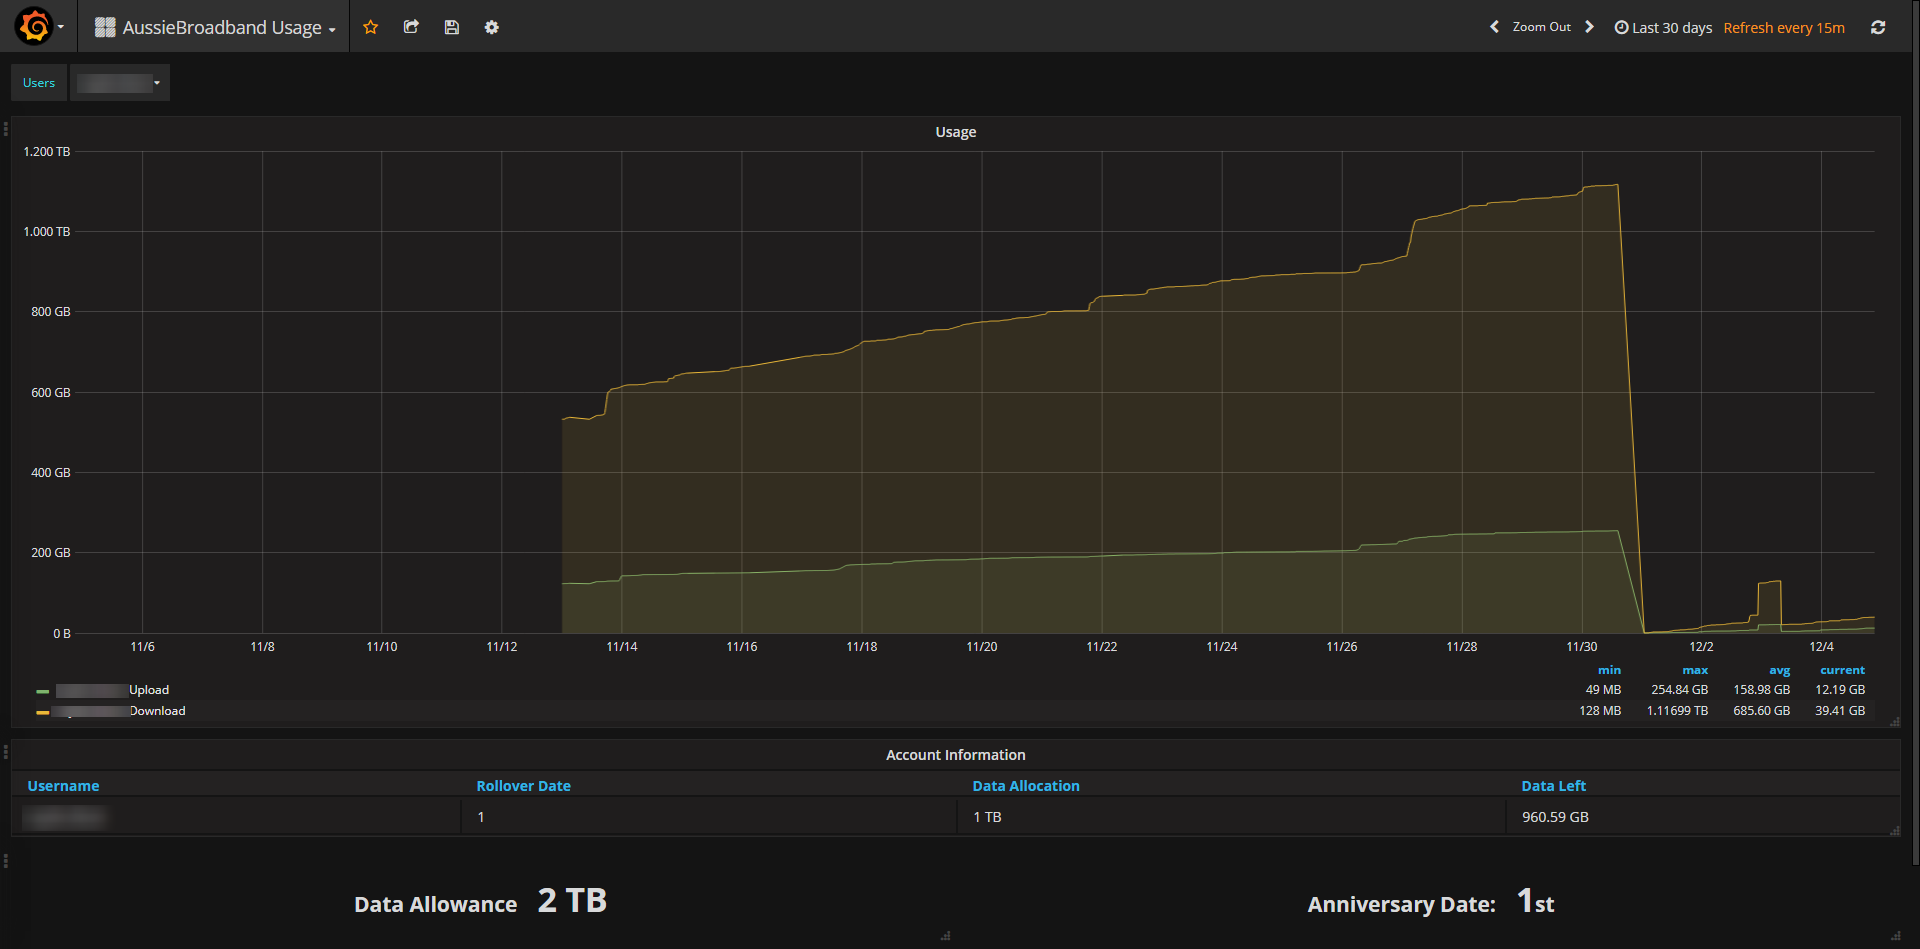
Usage monitor for influxdb and grafana
Settings:
Via the environment we are using the following:
| Key | Default Value | Description | Required |
|---|---|---|---|
ABB_DEBUG |
0 |
Set to 1 to turn on debugged output to stdout. | No |
INFLUX_HOST |
127.0.0.1 |
The host to connect that is running influxdb. | No |
INFLUX_PORT |
8086 |
The port for influxdb. | No |
INFLUX_DB |
aussiebb |
Influx database to use. | No |
INFLUX_USER |
root |
Username for influxdb | No |
INFLUX_PASS |
root |
Password for influxdb | No |
MYAUSSIE_USER |
Your username for myaussie, can be comma seperated to monitor multiple people | Yes | |
MYAUSSIE_PASS |
Your password for myaussie, has to be a 1:1 map for the usernames | Yes | |
SLEEP_INTERVAL |
900 |
The time in seconds to sleep between polling | No |
 Usage:
Import the Grafana JSON from the example below and it should allow you to monitor for those using grafana.