Support for row-oriented coordinates in Canvas.line #694
Conversation
datashader/glyphs.py
Outdated
| extend_line = _build_extend_line(draw_line, map_onto_pixel) | ||
|
|
||
| @ngjit | ||
| def extend_lines_xy(vt, bounds, xs, ys, plot_start, *aggs_and_cols): |
There was a problem hiding this comment.
I've had a go at rewriting this by adapting the extend_line code and that seems somewhat more efficient than unpacking this format and reusing the existing codepath. Probably needs some more fixes, but here's what my 10 minutes of hacking produced:
    @ngjit
    def extend_lines_xy(vt, bounds, xs, ys, plot_start, *aggs_and_cols):
        """
        here xs and ys are tuples of arrays and non-empty
        """
        xmin, xmax, ymin, ymax = bounds
        nrows = xs[0].shape[0]
        ncols = len(xs)
        i = 0
        while i < nrows - 1:
            plot_start = True
            j = 0
            while j < ncols - 1:
                x0 = xs[j][i]
                y0 = ys[j][i]
                x1 = xs[j+1][i]
                y1 = ys[j+1][i]

                # Use Liang-Barsky (1992) to clip the segment to a bounding box
                if outside_bounds(x0, y0, x1, y1, xmin, xmax, ymin, ymax):
                    plot_start = True
                    j += 1
                    continue

                t0, t1 = 0, 1
                dx = x1 - x0

                t0, t1, accept = clipt(-dx, x0 - xmin, t0, t1)
                if not accept:
                    j += 1
                    continue

                t0, t1, accept = clipt(dx, xmax - x0, t0, t1)
                if not accept:
                    j += 1
                    continue

                dy = y1 - y0

                t0, t1, accept = clipt(-dy, y0 - ymin, t0, t1)
                if not accept:
                    j += 1
                    continue

                t0, t1, accept = clipt(dy, ymax - y0, t0, t1)
                if not accept:
                    j += 1
                    continue

                if t1 < 1:
                    clipped = True
                    x1 = x0 + t1 * dx
                    y1 = y0 + t1 * dy

                if t0 > 0:
                    # If x0 is clipped, we need to plot the new start
                    clipped = True
                    plot_start = True
                    x0 = x0 + t0 * dx
                    y0 = y0 + t0 * dy

                x0i, y0i = map_onto_pixel(vt, bounds, x0, y0)
                x1i, y1i = map_onto_pixel(vt, bounds, x1, y1)
                draw_line(x0i, y0i, x1i, y1i, i, plot_start, clipped, *aggs_and_cols)
                plot_start = False
                j += 1
            i += 1

return extend_lines_xyThere was a problem hiding this comment.
Cool! @jonmmease, can you benchmark that like you did above?
There was a problem hiding this comment.
Using this on a 10M vertex trimesh wireframe using dask this renders in 0.5 seconds as opposed to 1.5 seconds with cvs.line.
There was a problem hiding this comment.
Awesome, thanks for giving this a try @philippjfr! I'll incorporate this approach and add it to my benchmarks
There was a problem hiding this comment.
Looks great! I think this will be very valuable to users, and I agree with your proposed directions 2 and 3. Very nice!
Can you please also update the user guide notebook http://datashader.org/user_guide/3_Timeseries.html to suggest using this data structure when your polylines are all of the same length, instead of the approaches proposed there now?
47779fb
to
72b2c68
Compare
|
@jbednar for documentation I was thinking of adding a section to http://datashader.org/user_guide/4_Trajectories.html for the case where you have a collection of fixed length trajectories (just make up some more random walks). Until we have (2) from the description above I think the last section of http://datashader.org/user_guide/3_Timeseries.html would still be a bit awkward because the user would need to create columns for the x-data that would repeat for every row. With (2) it will be a one-liner without any utility functions or work-arounds needed. What do you think? |
|
Ok, sounds good. In that case please briefly mention the new approach in 3_Timeseries, for now, and once approach 2 is implemented that section can be rewritten to use the new way. BTW, can approach 2 be approximated already in the current PR's code simply by passing the y column |
I'm not sure, I'll give it another look when I incorporate @philippjfr 's suggestion above. And if something looks relatively straightforward, I'll just go ahead and add it. |
|
Note that I'm just suggesting a (untested) way for the user to use the current code, not a change to the code... |
|
Updated performance results after implementing optimization suggested by @philippjfr in bc7631c:
Performance is now basically equivalent for single threaded-case and is much faster for multi-threaded case. |


|
I added a new API consideration to the main description:
I need to think about it a little more, but if we have an |
|
For the sake of discussion, here is a potential API that would allow this new functionality to be integrated into the existing New method signature: def line(self, source, x=None, y=None, agg=None, axis=0, x_constants=None, y_constants=None):
...Example source is a DataFrame with df = pd.DataFrame({
'A1': [...],
'A2': [...],
'B1': [...],
'B2': [...],
'A_ragged': RaggedArray(...),
'B_ragged': RaggedArray(...)
})One line across all rowsHere is an example of the current behavior of aggregating one line per DataFrame. The following example will produce a single length cvs.line(df, x='A1', y='B1')or with cvs.line(df, x='A1', y='B1', axis=0)Multiple lines across all rowsAn extension of the current behavior would be to allow cvs.line(df, x=['A1', 'A2'], y=['B1', 'B2'], axis=0)Multiple lines across all rows with one shared dimensionIf all of the lines share the same x coordinates, then this column could be specified as a string rather cvs.line(df, x='A1', y=['B1', 'B2'], axis=0)Many fixed length linesThe following example would aggregate one length-2 line per row, where the ith line has coordinates cvs.line(df, x=['A1', 'A2'], y=['B1', 'B2'], axis=1)Many fixed length lines with one shared dimensionThe following example would aggregate one length-2 line per row, where the ith line has coordinates cvs.line(df, x_constants=[0.0, 1.0], y=['B1', 'B2'], axis=1)Many variable length linesThe following example would aggregate one line per row, where the ith line has coordinates cvs.line(df, x='A_ragged', y='B_ragged', axis=1)Invalid API usageIn my mind the biggest drawback to this API is that some of the combinations of parameters will be invalid and it may be confusing for users to understand why. For example, Also, specifying But, I expect that a good docstring and helpful error messages should be enough to help people find the options that they want. What do you think? |
|
It looks very flexible and powerful to me! I wonder if there is some way to avoid having to introduce |
Yeah, I was hoping to avoid the need for |
|
I guess to refine my proposal then, an array or Pandas series type would be treated as a constant numeric vector, while if one has a numpy array of strings, you'd have to convert it to a list of strings for it to be treated as a list of column names. |
Works for me! |
|
Ok, I added the One line across all rowscvs.line(df, x='A1', y='B1')
cvs.line(df, x='A1', y='B1', axis=0)Many fixed length linescvs.line(df, x=['A1', 'A2'], y=['B1', 'B2'], axis=1)The other usages described above can be added in a follow-on PR. |
|
Alright, I went ahead and implemented all of the aggregation approaches in the proposed API except for RaggedArray. Examples from the new
|


|
Looks great!!! Thanks for rounding that out. Seems like a very reasonable API now. |
This allows subclasses to override how the DataFrame is used to compute the bounds
_compute_x_bounds -> compute_x_bounds

Co-Authored-By: jonmmease <jon.mease@gmail.com>
_compute_x_bounds -> compute_x_bounds

Co-Authored-By: jonmmease <jon.mease@gmail.com>
calling existing extend_lines function.
9d78c9e
to
dc8e83f
Compare
|
I added the Dask tests, and rewrote the last section of the Timeseries documentation to use the new approach. Ready for review @jbednar |
There was a problem hiding this comment.
Looks fabulous! This work really helps make all the various scenarios that come up in practice be handled efficiently and conveniently. Great work. I did look at every line of the code involved, but I have to admit that my eyes glaze over a bit in some of the deep line-drawing bits, so I can't honestly say that I'd have detected any problems there if any exist. :-) But from what I could focus on, it looks good, and is ready to merge when tests pass.
| return minval, maxval | ||
|
|
||
| @staticmethod | ||
| def maybe_expand_bounds(bounds): |
There was a problem hiding this comment.
Useful thing to refactor, thanks.
|
I modified the last example in the user-guide notebook so that it was a random walk with a fixed starting point:
This now seems like a very reasonable synthesized approximation to something people will use in practice, i.e. overlaying huge numbers of lines with the same starting point. |

|
Hmm, hitting an AppVeyor permission denied error on Python 2.7. Is this the same one we've been fighting with?
|

Overview
This PR introduces a new
Canvas.linesmethod for rendering collections of polylines (here called "lines" for short) where each polyline corresponds to a single row in an input DataFrame. This is in contrast to the currentCanvas.linemethod which renders a single polyline (potentially containing gaps if there are nan values) per DataFrame.I propose that this method eventually be overloaded to support the following 3 use-cases. Note: This PR only implements (1), but I'm hopeful that the addition of (2) and (3) will not require much additional refactoring.
N, and is represented byNcolumns containing the x coordinates andNcolumns containing the y coordinates. Here's an example in the case of two-vertex line segments (N=2):N, but either the x or y vertex coordinates are constant for all lines. A common use-case here would be time-series data, where the x values (the time bins) are constant across all lines and each row of the DataFrame contains only the y-coordinates of each line. This would nicely handle cases like the one brought up in Plotting many lines as separate columns takes a long time #286 (comment), without the need to concatenate and nan separate each line. Here's what the aggregation step for this example could look like:Note that the
datanumpy array is converted into a DataFrame before being passed tocvs.lines. This DataFrame will have columns with integer labels that match the column index, and so they=list(range(50))argument is specifying a list of the column labels where the column labels are integers. As suggested in #283, it would also be nice to allow DataShader to accept a numpy (or Dask) array directly without requiring this DataFrame conversion step. I see this as a somewhat orthogonal feature that would require support across several other parts of the API.Additional consideration: For cases 1 and 2, we should also have a way to specify whether lines are
represented by rows (as I originally had in mind writing the descriptions above) or by columns. Representing lines by rows is useful when the line lengths are manageable, but there are lots and lots of lines. Specifying lines by columns is useful when the number of lines is manageable, but each line has lots and lots of points.
Example
Drawing line segments
Performance
Edit: See updated performance results in #694 (comment)
Here are some performance comparisons comparing
cvs.lineswith the equivalentcvs.linecommand for the segment example above. Timing does not take into account the time to generate the nan separated DataFrame needed bycvs.line.And here's what scaling looks like on my quad-core 2015 MBP.
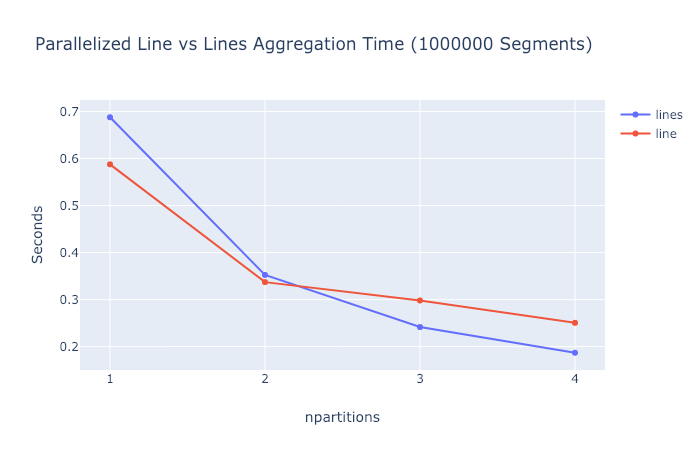
So the current
cvs.lineapproach is consistently a little bit faster in the single-threaded case. But if the conversion time were taken into account this difference would probably get washed out. And for some reason the newcvs.linesapproach seems to scale a little better in the multi-threaded case (at least for 3 and 4 cores).TODO
cvs.linemethod by adding a new "lines-by-rows-or-columns" argument. Either way, sketch out the future API for the by-rows and by-columns cases.