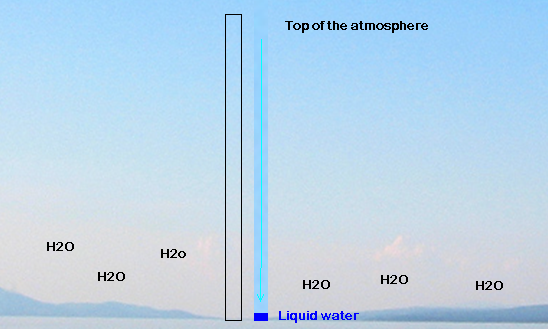
Precipitable water is the amount of condensed water vapor to be found in a vertical column of air, with a base of 1 meter-squared, that
extends from the surface of the Earth to the top of the atmosphere.

Figure 1: Schematic illustrating the concept of precipitable water. The left column contains air and water vapour, the right column contains dry air and condensed water vapour on the bottom of the column [1].
Precipitable water is important because:
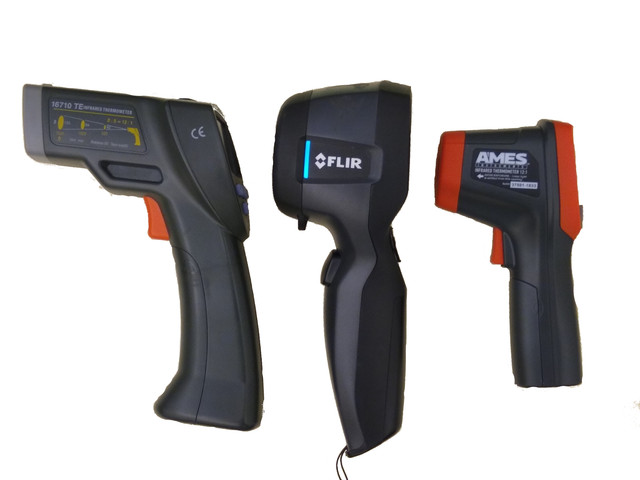
This experiment used three infrared sensors (from left to right):
When using the model for your analysis, take the time to fully complete the

Figure 1: Schematic illustrating the concept of precipitable water. The left column contains air and water vapour, the right column contains dry air and condensed water vapour on the bottom of the column [1].
Precipitable water is important because:
- Energy is transferred from the surface to the atmosphere via water vapor, and is released as latent heat. Precipitable water helps us determine the amount of energy in the atmosphere.
- Weather forecasting models can use precipitable water data to determine the likelihood of storms, hail, and other major meteorological events.
- The relationship between air temperature and the amount of water vapor is linear. Therefore, precipitable water measurements can be used to determine temperature increases at higher altitudes.

This experiment used three infrared sensors (from left to right):
- 1610 TE
- FLIR i3
- AMES
When using the model for your analysis, take the time to fully complete the
_pmat.yml
file with the appropriate information. This will assure that the data
properly corresponds to the labels of the sensors. If there is an entry
that you are unable to fill, please use NA as a filler. More information
regarding the different columns of the _pmat.yml will
be discussed in the Working with data and PMAT section of the Official PMAT Documentation.
The Precipitable-water Model Analysis Tool (PMAT) is a computational utility that is used to analyze the data collected from this project to understand the relationship between the zenith sky temperature and precipitable water in the atmosphere. For more information regarding PMAT, visit the Official Documentation Page.
| 1 | Determine the scope of project and reporting frequency |
| 2 | Identify the closest MesoWest and wyoming sites to your area. |
| 3 | Determine daily measurement site and time, to ensure consistent measurements happen. |
| 4 | Decide on different infrared thermometers to take measurements with |
| 1 | At the same location and time take both ground and zenith sky temperature readings with the thermometers (Ensure that the sun is not directly above when taking your readings) |
| 2 |
Record the ground and zenith sky temperature for each thermometer
(If the zenith sky reading is obstructed by cloud cover, record the condition as overcast. Otherwise record the condition as clear sky) (Do not leave blanks in your dataset. Any value that is not available needs to be marked as -Inf or NaN) |
| 3 | Retrieve precipitable water readings and add them to your dataset |
If you would like to contribute to this project, visit our contribution page.
The future development of this project with regards to the data collection include a machine learning approach to determining weather condition (Clear sky/Overcast). We are also in the process of developing a method of automating the temperature measurement process using an Arduino-Raspberry Pi network.
