When I was a kid i loved RollerCoaster Tycoon. I recently found out that Atari had ported the classic game for iOS, and I immediately purchased it. Now I play whenever I get a free moment. Usually I manage to play a few games a week while I watch TV or listen to podcasts.
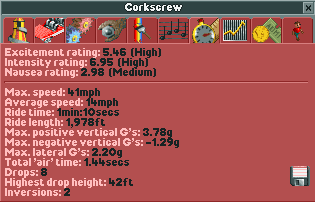
If you do not know, a main aspect of the game involves designing custom roller coasters. When you build something new, you can go to a special window to view the ride statistics:
The most important metrics are at the top: You want to maximize excitement without making the ride too intense or nauseating.
When I was a kid I had no patience for numbers (I created rides for maximum awesomeness), but these days I'm fond of that sort of thing. After I completed a few park scenarios, I began to wonder If i can use my own data to build better roller coasters. So I started saving my ride stats in a spreadsheet: After completing each scenario, I just logged the stats from each ride into the spreadsheet. This repository contains that data, as well as any analyses I might conduct on it.
I still play a few games a week (duh), so occasionally I will update the database with my future creations (feel free to send me your own!). Each ride is cataloged based on the info from the window above:
park_id: Integer. Unique park identifier, zero-indexed.theme: String. Title of the park scenario.rollercoaster_type: String. Category of roller coaster.custom_design: Boolean. True/False on whether I designed the ride, or if it was pre-designed.excitement: Float. Ride excitement from 0 (very low) with no specified maximum, but it is very rarely above 10.0. Larger numbers are always better.intensity: Float. Ride intensity from 0 (very dull) with no specified maximum, though most (well-designed) rides are under 10.0. Each customer has their own intensity preference.nausea: Float. Ride nausea from 0 (very low) with no specified maximum, but lower is better and rides rarely have values above 10.0.excitement_rating,intensity_rating,nausea_rating: String. Descriptors of the excitement, intensity, and nausea ratings.max_speed: Integer. Maximum speed (mph).avg_speed: Integer. Average speed (mph).ride_time: Integer. Total duration of the ride in seconds.ride_length: Integer. Length of the ride in feet.max_pos_gs,max_neg_gs,max_lateral_gs: Float. Values describing the maximum observed positive, negative, and lateral G-Forces.total_air_time: Float. Number of seconds in which riders experience weightlessness.drops: Integer. Number of downhill segments.highest_drop_height: Integer. Highest height (with 0 being sea-level?) from which a drop takes place. Note: rides can drop to -6 in the game.inversions: Integer. Number of times riders are upside-down during the ride. This accounts for loops, corkscrews, etc. values of-1indicate missing information (see caveat #2).
- So far I've only been keeping track of roller coasters, so the data does not include customizable thrill rides or water rides (excepting the Dinghy Slide, which is classified as a roller coaster in the game).
- It is unfortunate that the first handful of rides I built did not have any inversions, and it took me several weeks to realize that the game does not show this info unless there are inversions. During that time, I simply ignored the inversions count, so we just do not have that info for many rides. Some rides cannot have inversions, and I filled in that information after the fact. So, a value for
inversions = -1indicates that the ride could have had inversions.
