Skip to content
forked from TLmaK0/gravizo

How to include graphviz graphs in github README

Notifications You must be signed in to change notification settings

lodoyun/gravizo


Folders and files

NameName
Last commit message
Last commit date

Latest commit


History

22 Commits


Repository files navigation

gravizo

How to include graphviz graphs in github README.md

Only need to include image markdown tag with the url http://g.gravizo.com/g? followed by your description graph in DOT syntax, UMLGraph, PlantUML or SVG :

![Alt text](http://g.gravizo.com/g? digraph G { aize ="4,4"; main [shape=box]; main -> parse [weight=8]; parse -> execute; main -> init [style=dotted]; main -> cleanup; execute -> { make_string; printf}; init -> make_string; edge [color=red]; main -> printf [style=bold,label="100 times"]; make_string [label="make a string"]; node [shape=box,style=filled,color=".7 .3 1.0"]; execute -> compare; } )

![Alt text](http://g.gravizo.com/g?
  digraph G {
    aize ="4,4";
    main [shape=box];
    main -> parse [weight=8];
    parse -> execute;
    main -> init [style=dotted];
    main -> cleanup;
    execute -> { make_string; printf};
    init -> make_string;
    edge [color=red];
    main -> printf [style=bold,label="100 times"];
    make_string [label="make a string"];
    node [shape=box,style=filled,color=".7 .3 1.0"];
    execute -> compare;
  }
)

This allow to include your graphs in the README, and still redeable in normal text editor.

SVG output it's ready. Only need to replace http://g.gravizo.com/g? by http://g.gravizo.com/svg? and http://g.gravizo.com/source? by http://g.gravizo.com/source/svg?

![Alt text](http://g.gravizo.com/svg? digraph G { aize ="4,4"; main [shape=box]; main -> parse [weight=8]; parse -> execute; main -> init [style=dotted]; main -> cleanup; execute -> { make_string; printf}; init -> make_string; edge [color=red]; main -> printf [style=bold,label="100 times"]; make_string [label="make a string"]; node [shape=box,style=filled,color=".7 .3 1.0"]; execute -> compare; } ) ###New. The indirect way.### You can use indirect way to refer a source file as graph description. Alt text

Use this sintax: ![Alt text](http://g.gravizo.com/source/<custom_mark>?<url_source_url_encoded>). And use html comments <!--- --> to hide the source.
![Alt text](http://g.gravizo.com/source/custom_mark?https%3A%2F%2Fraw.githubusercontent.com%2FTLmaK0%2Fgravizo%2Fmaster%2FREADME.md)
<!---
custom_mark
@startuml
object Object01
object Object02
object Object03
object Object04
object Object05
object Object06
object Object07
object Object08

Object01 <|-- Object02
Object03 *-- Object04
Object05 o-- "4" Object06
Object07 .. Object08 : some labels
@enduml
custom_mark
-->

Because limitations of the url you can use in direct way (not in indirect way) markdown, you should use the Converter to see more complex graphs:

![Alt text](https://g.gravizo.com/g? /** *Structural Things *@opt commentname *@note Notes can *be extended to span multiple lines / class Structural{} / *@opt all @note Class / class Counter extends Structural { static public int counter; public int getCounter%28%29; } / *@opt shape activeclass *@opt all *@note Active Class */ class RunningCounter extends Counter{} )

![Alt text](http://g.gravizo.com/g?
/**
*Structural Things
*@opt commentname
*@note Notes can
*be extended to
*span multiple lines
*/
class Structural{}
/**
*@opt all
*@note Class
*/
class Counter extends Structural {
        static public int counter;
        public int getCounter%28%29;
}
/**
*@opt shape activeclass
*@opt all
*@note Active Class
*/
class RunningCounter extends Counter{}
)

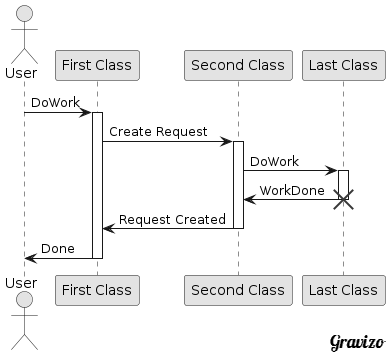
A sequence diagram. Note that you need to include ; in each new line:
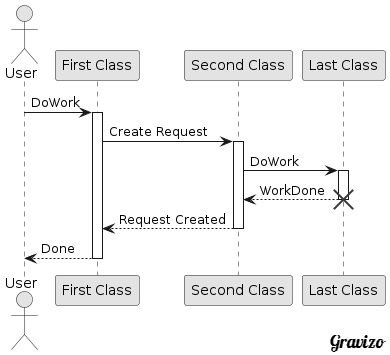
![Alt text](http://g.gravizo.com/g? @startuml; actor User; participant "First Class" as A; participant "Second Class" as B; participant "Last Class" as C; User -> A: DoWork; activate A; A -> B: Create Request; activate B; B -> C: DoWork; activate C; C --> B: WorkDone; destroy C; B --> A: Request Created; deactivate B; A --> User: Done; deactivate A; @enduml )

![Alt text](http://g.gravizo.com/g?
@startuml;
actor User;
participant "First Class" as A;
participant "Second Class" as B;
participant "Last Class" as C;
User -> A: DoWork;
activate A;
A -> B: Create Request;
activate B;
B -> C: DoWork;
activate C;
C --> B: WorkDone;
destroy C;
B --> A: Request Created;
deactivate B;
A --> User: Done;
deactivate A;
@enduml
)

An activity diagram. Note that you need to include ; in each new line:

![Alt text](http://g.gravizo.com/g? @startuml; %28*%29 --> if "Some Test" then; -->[true] "activity 1"; if "" then; -> "activity 3" as a3; else; if "Other test" then; -left-> "activity 5"; else; --> "activity 6"; endif; endif; else; ->[false] "activity 2"; endif; a3 --> if "last test" then; --> "activity 7"; else; -> "activity 8"; endif; @enduml )

![Alt text](http://g.gravizo.com/g?
@startuml;
%28*%29 --> if "Some Test" then;
  -->[true] "activity 1";
  if "" then;
    -> "activity 3" as a3;
  else;
    if "Other test" then;
      -left-> "activity 5";
    else;
      --> "activity 6";
    endif;
  endif;
else;
  ->[false] "activity 2";
endif;
a3 --> if "last test" then;
  --> "activity 7";
else;
  -> "activity 8";
endif;
@enduml
)

Now also suports SVG in JSON format:

![Alt text](http://g.gravizo.com/g? @gravizosvg {"svg": { "@height": "450", "@width": "450", "path": [ {"@id":"lineAB", "@d": "M 100 350 l 150 -300", "@stroke":"red"}, {"@id":"lineBC", "@d": "M 250 50 l 150 300", "@stroke":"red"}, {"@d":"M 100 350 q 150 -300 300 0", "@stroke":"blue", "@fill":"none"} ], "g": [ {"@stroke":"black", "circle":[
{"@id":"pointA", "@cx":"100", "@cy":"350", "@r":"3"}, {"@id":"pointB", "@cx":"250", "@cy":"50", "@r":"3"}, {"@id":"pointC", "@cx":"400", "@cy":"350", "@r":"3"} ]}, {"text": [ {"@x":"100", "@y":"350", "@dx":"-30", "$":"A"}, {"@x":"250", "@y":"50", "@dy":"-10", "$":"B"}, {"@x":"400", "@y":"350", "@dx":"30", "$":"C"} ]} ] } } )

![Alt text](http://g.gravizo.com/g?
@gravizosvg
{"svg": {
		"@height": "450",
		"@width": "450",
		"path": [
			{"@id":"lineAB", "@d": "M 100 350 l 150 -300", "@stroke":"red"},
			{"@id":"lineBC", "@d": "M 250 50 l 150 300", "@stroke":"red"},
			{"@d":"M 100 350 q 150 -300 300 0", "@stroke":"blue", "@fill":"none"}
    ],
		"g": [
			{"@stroke":"black", "circle":[  
				{"@id":"pointA", "@cx":"100", "@cy":"350", "@r":"3"},
				{"@id":"pointB", "@cx":"250", "@cy":"50", "@r":"3"},
				{"@id":"pointC", "@cx":"400", "@cy":"350", "@r":"3"}
			]},
			{"text": [
				{"@x":"100", "@y":"350", "@dx":"-30", "$":"A"},
				{"@x":"250", "@y":"50", "@dy":"-10", "$":"B"},
				{"@x":"400", "@y":"350", "@dx":"30", "$":"C"}
			]}
		]
	}
}
)

About

How to include graphviz graphs in github README

Resources

Stars

Watchers

Forks

Releases

No releases published

Packages

No packages published