You signed in with another tab or window. Reload to refresh your session.You signed out in another tab or window. Reload to refresh your session.You switched accounts on another tab or window. Reload to refresh your session.Dismiss alert
There seems to be an issue where the transform on new data does not give the expected results.
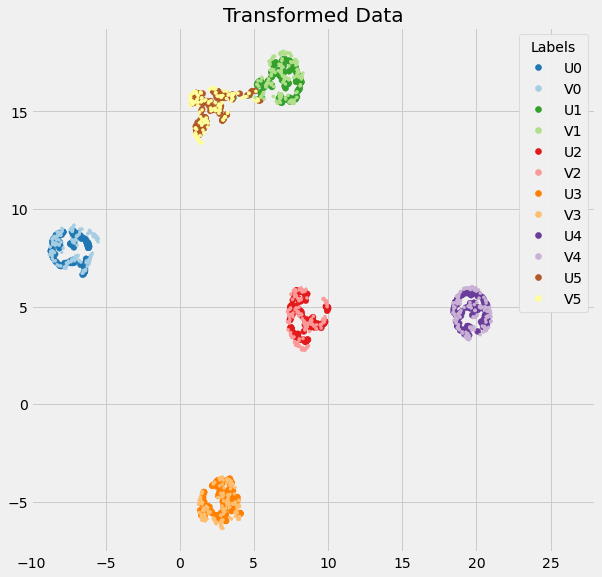
If we fit_transform on some data X, then transform Y = X + e (for some small perturbation e), the transforms are quite different (see picture and reproducing code below).
# Import modulesimportnumpyasnpfrommatplotlibimportpyplotaspltfromsklearn.datasetsimportmake_blobsfromumapimportUMAP# Create the data setnp.random.seed(314159)
X,y=make_blobs(n_samples=1000,centers=6,random_state=10)
# Y is X plus random small displacementY= (X+(2*np.random.random(size=X.shape)-1)/1000)
# Transform with UMAPprojection=UMAP(min_dist=0,random_state=16180339)
U=projection.fit_transform(X)
V=projection.transform(Y)
# Plot resultsplt.style.use('fivethirtyeight')
defplot_scatter(ax,A,B,lA,lB,title,xlim=None,ylim=None):
scatter1=ax.scatter(*A.T,c=2*y+1,
cmap=plt.cm.Paired,
vmin=0,vmax=12,
marker='o')
scatter2=ax.scatter(*B.T,c=2*y,
cmap=plt.cm.Paired,
vmin=0,vmax=12,
alpha=1,
marker='.')
elements=np.array([(a,b) fora,binzip(scatter1.legend_elements()[0],
scatter2.legend_elements()[0])
]).flatten()
legend=ax.legend(elements,[lA+'0',lB+'0',lA+'1',lB+'1',lA+'2',lB+'2',
lA+'3',lB+'3',lA+'4',lB+'4',lA+'5',lB+'5',],
title="Labels")
ax.add_artist(legend)
ax.set_title(title)
ifxlim:
ax.set_xlim(xlim)
ifylim:
ax.set_ylim(ylim)
returnfig,axs=plt.subplots(1,2,figsize=(16,8))
axs=axs.flatten()
ax=axs[0]
plot_scatter(ax,X,Y,'X','Y','Original Data')
ax=axs[1]
plot_scatter(ax,U,V,'U','V','Transformed Data',xlim=(-10,28))
plt.show()
We see that the two datasets X and Y, which are approximately the same in the original space, are mapped to different regions by UMAP. This could be a problem for people using UMAP in an ML pipeline (e.g. light purple points are closer to dark red than dark purple, and may be misclassified)
Upon some investigation, I think that this is caused by two problems: One where the initial embedding is off (init_graph_transform); and another where optimize_layout... is called.
Which gives an initial embedding for Y which can be different to that of X, even though Y≈X. This is fixed by normalising via the row sum instead of the num_neighbours.
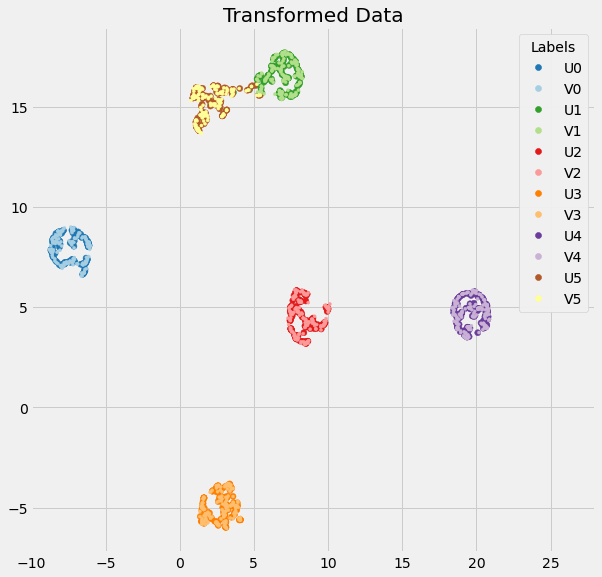
After this change, the initial embeddings for X and Y are practically identical, and this greatly improves the resulting transform:
However, it's still not quite right (you'll notice that the blue points in particular are slightly off). This is due to the optimize_layout... functions, and when their move_other argument is activated. I think that move_other should only be True in the fit_transform(), not in the transform(). The way this is currently coded is a check on the shape of the tail/head embeddings:
However, this is inaccurate when new 'to be transformed' data is the same shape as the old fit_transform data. I suggest that move_other should be passed in as an argument depending on where the optimize_layout functions are called from. If we force move_other=False in the transform step, we arrive at the final embedding for the new data, which seems to be accurate (that is to say, it is what one might intuitively expect):
I have a pull request ready with these changes implemented that I'll put in shortly, but do let me know if I've got the wrong end of the stick somewhere.
Many thanks
The text was updated successfully, but these errors were encountered:
This is an excellent analysis -- and yes, it all looks right. Thanks for taking the time to look into this, and also for providing such a well documented report on the issue. I'll look at the PR soon and hopefully we can get it merged very quickly. Again, many thinks for this!
There seems to be an issue where the transform on new data does not give the expected results.
If we fit_transform on some data X, then transform Y = X + e (for some small perturbation e), the transforms are quite different (see picture and reproducing code below).
We see that the two datasets X and Y, which are approximately the same in the original space, are mapped to different regions by UMAP. This could be a problem for people using UMAP in an ML pipeline (e.g. light purple points are closer to dark red than dark purple, and may be misclassified)
Upon some investigation, I think that this is caused by two problems: One where the initial embedding is off (init_graph_transform); and another where optimize_layout... is called.
In init_graph_transform we have the line
Which gives an initial embedding for Y which can be different to that of X, even though Y≈X. This is fixed by normalising via the row sum instead of the num_neighbours.
After this change, the initial embeddings for X and Y are practically identical, and this greatly improves the resulting transform:

However, it's still not quite right (you'll notice that the blue points in particular are slightly off). This is due to the optimize_layout... functions, and when their move_other argument is activated. I think that move_other should only be True in the fit_transform(), not in the transform(). The way this is currently coded is a check on the shape of the tail/head embeddings:
However, this is inaccurate when new 'to be transformed' data is the same shape as the old fit_transform data. I suggest that move_other should be passed in as an argument depending on where the optimize_layout functions are called from. If we force move_other=False in the transform step, we arrive at the final embedding for the new data, which seems to be accurate (that is to say, it is what one might intuitively expect):

I have a pull request ready with these changes implemented that I'll put in shortly, but do let me know if I've got the wrong end of the stick somewhere.
Many thanks
The text was updated successfully, but these errors were encountered: