Adaptive Sampling #365
Comments
|
Any idea when the backend functionality will be opensourced? |
|
"Adaptive Sampling" is now ok in backend? |
|
it's coming soon, @black-adder just finished rolling it out internally to all services, so it just needs a bit clean-up (from any internal deps) to move to open source. |
|
thks @yurishkuro , i am investigating the jaeger and zipkin。 |
|
@yurishkuro any progress on this being released? |
|
question to @black-adder , "he is a-cooking something up" |
|
@black-adder any news? |
|
sorry all, I just started to move the pieces over, hopefully we'll have the whole thing in OSS this week. |
|
What's the status on this? I would like to configure Jaeger to sample all traces on low load, and on high load sample at a certain probability. It doesn't seem possible currently. Thanks. |
|
Hi, is adaptive sampling still under way? I'm really eager to try it out for my sample app. |
|
The PRs are in progress/review. Unfortunately, a higher priority project has delayed this. |
|
It's very important |
|
Another check in on progress for this. We are considering an implementation of this and this would be a great feature add. |
|
Any further news on this? |
|
This feature would help us as well - it seems that under high load, some spans are being dropped / never received by ES (since we are trying to sample all traces currently). We are hoping to sample 100% of "unique" traces (similar to what differentiates traces in "Compare" in the UI) in the last X amount of time. Heard about this idea from an OpenCensus talk, which sounded like they're working on a similar feature in their agent service. |
|
Any further news on this? I am looking forward to this feature |
|
the main code has been merged, pending wiring into collector's main |
|
@capescuba @wuyupengwoaini @adinunzio84 @csurfleet not sure if this helps in your current context, but the way we've been implementing an approximation of this feature for our usecase (moderately high throughput- 10s of thousands of requests per second) is we set keys in redis that control sampling through the use of the sampling priority debug header. In other words we set the default probabilistic sampling rate to zero and the code checks a set of redis keys to know whether it should sample. So for example in the context of my particular scenario we get requests from many different applications and devices, and in redis we set keys denoting which apps or devices we want to trace and what percentage of requests for those apps we want to trace. So if we have a specific issue to debug we set redis keys to trace 100% of requests from the problematic app and some low percentage of requests from apps that we are passively monitoring span.set_tag(ext_tags.SAMPLING_PRIORITY, 1) |
|
@trtg Thanks for your advice. In fact, I think the sampling rate strategy can be divided into three steps: 1. The sampling rate is configurable. That is to say there is a system to configure the sampling rate of each interface in each service. 2. The configuration can be dynamically activated (can be implemented by means of a configuration center or the like) 3. The system automatically configures the sampling rate dynamically according to the pressure of the jaeger backend. Dynamically configuring the sample rate for your use of redis is actually the second step I mentioned above. This can modify the sampling rate in real time, but it is enough. |
|
Hey all, I've created a nuget package that allows per-request sampling on anything in the incoming HttpRequest, feel free to have a play. Any suggestions etc either let me know or send me a PR ;) I'm using this stuff in production for one app so far, and I'll try to add further stuff later on: |
|
Hi @yurishkuro! Just reading about the different sampling strategies in Jaeger, and it's slightly unclear to me whether Adaptive Sampling would reference a central configuration (which would be somewhat less verbose than in the 'sampling strategies' file), or whether we'd specify the sampling rate in the service (and that the adaptive sampler would ensure lower QPS endpoints have their fair share of traces). Cheers! |
|
@DannyNoam This ticket refers to dynamic adaptive sampling where strategies are automatically calculated based on observed traffic volumes. In jaeger-collector the only configuration would be "target rate of sampled traces / second" (in the current code it's a single global setting, but we're looking to extend it to be configurable per service/endpoint). |
@yurishkuro any timeline on when this will be wired into collector's main? |
I was thinking that with a small generalization, one could extend the adapting sampling idea to something between head-based and tail-based sampling that also detects outliers and has other benefits of tail-based sampling while requiring fewer computational resources. As part of the adapting sampling, sampling information is communicated from the collector to the agent. The format of the communicated data has, I guess, format similar to the Collector Sampling Configuration. In the documentation there's this example: We can change it slightly to this: What do we see here?
This small extension enables the client and the agent to do powerful cherry-picking of what to sample. The rules defined above are evaluated at any point in time a Span changes. More specifically, Spans in Jaeger, can be represented as JSONs that adhere to this model. Examples can be found in example_trace.json: Pieces of information are collected at different points in time. e.g. the
The above might seem as high CPU overhead, but I can imagine many optimizations that return quickly if there are no rules that match a Span change. JIT compilation of the rules might also be a way to accelerate further. The high performance of Chrome, DOM and V8 indicate that we might be able to have fast implementations. Here are some basic examples. To evaluate them, I wrap the example Span presented above to a The following condition evaluates to There are two default "force sample" rules in Jaeger. Can we implement them using this framework? Yes: and In those two cases the There are two safety conditions we would like to guarantee:
As a result, proper engineering should be put in place. The language of JsonLogic isn't turning complete but still, there could be problems if the Spans have tags with long string values, long arrays or the configuration has rules that are overly long. Rules can be auto-generated, e.g. by some real-time trend analysis system, so it's wise to put some controls in the agent/client that reject configurations that might be slow. On the second point, above, if the rules end-up sampling everything while our infrastructure can handle just 1:100 sampling, we wouldn't like to overwhelm infra. As a result, we might need some form of cascading rules or global mechanism that limits total throughput. Can we use this form of adaptive sampling to implement rules that sample outliers in terms of duration? Yes. Here's such a rule: We can test it with a (simplified) example span: Note that we now need a Since we now define and use a Span model, it would be good to also formalize a few more attributes it could have and be potentially useful. For example, we can have "span.parent.operationName", " span.parent.parent.process.seviceName" of a Span (parent might need to be an array - but let's skip this for now). Those don't need to be supported for any middleware or configuration, but if a middleware supports passing downstream some tags or Span attributes (e.g. through baggage) in-band, it's nice to know where to find them. With this extension, one can write rules that sample at a given operation and parent operation. As mentioned before, it might be possible to do this also, when you make the request, on the caller, instead of on the child-span, but As a natural extension on the above, we can define an attribute |
|
@lookfwd great proposal! We're actively discussing it right now for an internal project. One major issue we bumped into with it is this: when possible strategies are represented as a list and need to be matched one by one for a given span, it works pretty well if the match process runs only once. But in your proposal there's no specific demarcation event that tells the tracer "do it now", instead matching can run multiple times as tags are being added to the span. The problem is that a list of strategies would typically include a default fallback strategy when nothing custom matches, and the default strategy will always match, even on the first try, so there won't be time to set span tags and potentially match any other custom strategies. We could introduce the demarcation event artificially, e.g. as some static method in Jaeger or a special span tag that can be used to signal "apply sampling rules now". But it's kind of ugly and requires additional instrumentation in the code. Thoughts? |
|
@yurishkuro - sorry, I missed it. The points when one needs to know if sampling is true or false, is when the context is about to be injected to a carrier or when one is about to finish the Span. If those are used as "apply sampling rules now" trigger(s) i.e. lazily evaluating More specifically I would expect the user/framework to set all the tags before it injects or finish()'s.
If the default strategy is a lower bound rate limiter, it should be sufficient to inform about the existence of "weird" spans that e.g. set tags after injecting, without flooding the system. |
|
@lookfwd you might be interested in these two PRs (jaegertracing/jaeger-client-node#377, jaegertracing/jaeger-client-node#380), which introduce a shared sampling state for spans in-process and allow delaying sampling decision. |
I have some thoughts in high level in the following lines: At the Collector level, For each Host level, we can run some kind of baseline calculation on key KPIs like # of Error, 90th Response Time or Throughput for every < X> Observation window. This observation interval can be like for every 5 min or every 10 mins or < auto-calculated>. This Observation window can be auto-calculated from Throughput ( or Operation /Sec at every Service Level). If the base line is breached from previous observation window, then we can trigger adaptive sampling from Collector to Agent thru callback function to Agent for each service level. I mean Agent will send to collector, If all is safe within the baseline, Agent will purge within its perimeter. The point here is, there may be broken parent or broken childs (or Spans) for completing end-2-end transaction. Of course , it will be complex design though . @yurishkuro: I just tried my imagination on high level design. Pls. go thru and take your own call. |
|
I am not sure where to post this (I also asked in Gitter), but I will ask here since it seems like a problem with adaptive sampling and the standard implementation with the client libraries. In our collector, we define the remote sampling configuration strategies and for some default endpoints ( Is there currently a way to disable the sampling for specific endpoints ? Or perhaps it is a bug that that the We are using Jaeger collector 1.8 and the latest release of |
|
@agaudreault-jive it's probably a limitation of the data model of GuaranteedThroughputSampler - it only supports probability value per-endpoint, while the lowerbound rate limiter applies across all endpoints. It's possible to extend the model, but will require pretty substantial changes. BTW, 1 TPS seems very high for lowerbound, we're using several orders of magnitude smaller value. |
|
Any update on this feature? There are many merged pull-requests. Will this be finished? |
|
Hi @yurishkuro I don't know if my skillset is good enough to solve this ticket but I would like to take a stab at it. I would like to ask you if you can summarise the work which is remaining here. My understanding from looking at the two PRs is that we just need to invoke the adaptive sampling processor from collector/main.go. Thank you. |
|
@Ashmita152 you're correct, I think pretty much all of the code is already in the repo, it just needs hooking up in the collector and exposing configuration parameters via flags. It would be fantastic if we can get this in, this last piece was outstanding for over 2yrs. |
|
Sure Yuri, I will give it a try. Thank you. |
|
any news? work now? or any plan? |
|
@joe-elliott picked this up in #2966 |
|
I've made some try in my project. I combined rate sampling and rate limiter together. At the mean time, I sampled pod cpu&mem status to auto adjust sampling rate. It goes well in my production env. |
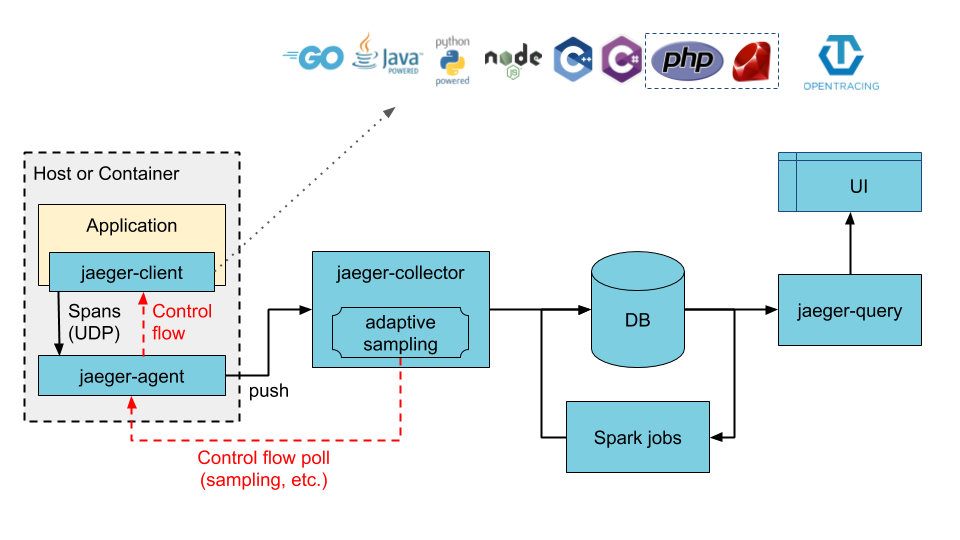
Problem
The most common way of using Jaeger client libraries is with probabilistic sampling which makes a determination if a new trace should be sampled or not. Sampling is necessary to control the amount of tracing data reaching the storage backend. There are two issues with the current approach:
Proposed Solution
The adaptive sampling is a solution that addresses these issues by:
Status
Pending open-source of the backend functionality. Client work is done.
The text was updated successfully, but these errors were encountered: