In Machine Learning and Statistic, Dimensionality Reduction the process of reducing the number of random variables under consideration via obtaining a set of principal variables. It can be divided into feature selection and feature extraction.
In this repository we have applied Dimensionality reduction algorithms i.e PCA,LDA and FDA on CIFAR-10, MNIST and F-MNIST datasets
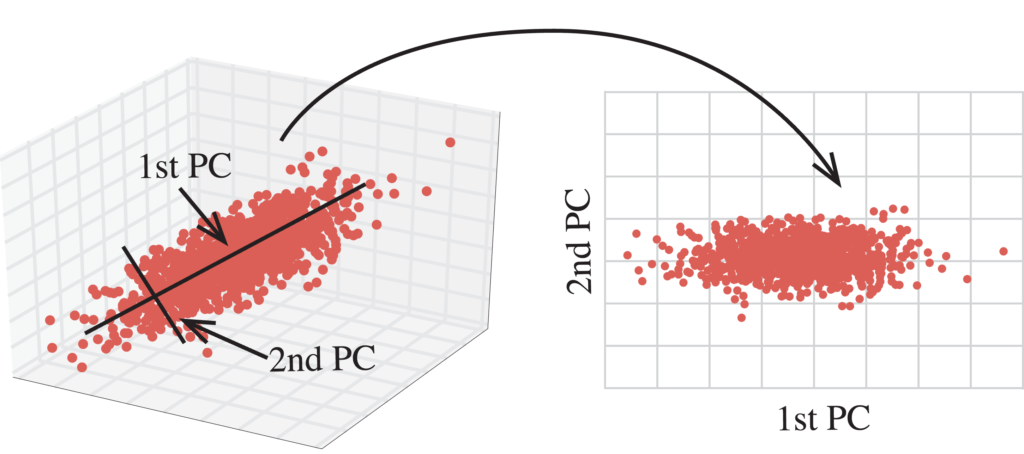
Principal component analysis, or PCA, is a statistical technique to convert high dimensional data to low dimensional data by selecting the most important features that capture maximum information about the dataset. The features are selected on the basis of variance that they cause in the output. The feature that causes highest variance is the first principal component. The feature that is responsible for second highest variance is considered the second principal component, and so on. It is important to mention that principal components do not have any correlation with each other.

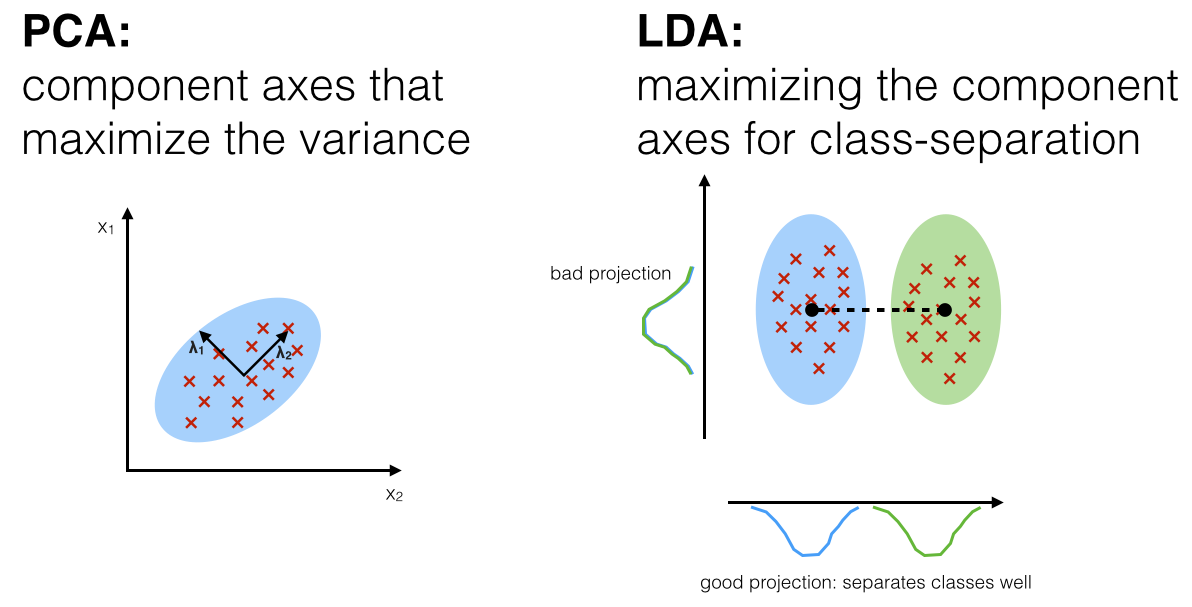
Both PCA and LDA are linear transformation techniques. However, PCA is an unsupervised while LDA is a supervised dimensionality reduction technique. Unlike PCA, LDA tries to reduce dimensions of the feature set while retaining the information that discriminates output classes. LDA tries to find a decision boundary around each cluster of a class. It then projects the data points to new dimensions in a way that the clusters are as separate from each other as possible and the individual elements within a cluster are as close to the centroid of the cluster as possible. The new dimensions are ranked on the basis of their ability to maximize the distance between the clusters and minimize the distance between the data points within a cluster and their centroids. These new dimensions form the linear discriminants of the feature set.

Fisher’s linear discriminant can be used as a supervised learning classifier. Given labeled data, the classifier can find a set of weights to draw a decision boundary, classifying the data. Fisher’s linear discriminant attempts to find the vector that maximizes the separation between classes of the projected data. Maximizing “separation” can be ambiguous. The criteria that Fisher’s linear discriminant follows to do this is to maximize the distance of the projected means and to minimize the projected within-class variance.

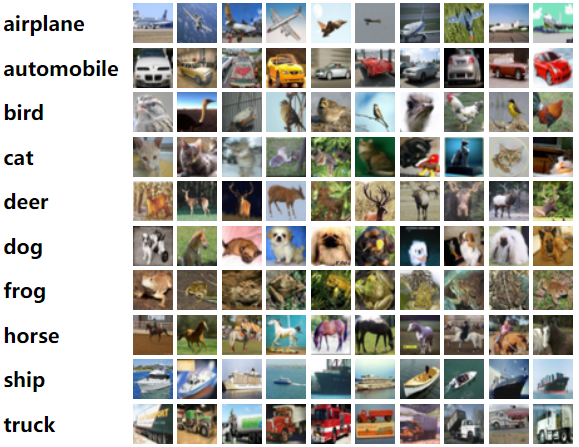
The CIFAR-10 dataset consists of 60000 32x32 colour images in 10 classes, with 6000 images per class. There are 50000 training images and 10000 test images.
The dataset is divided into five training batches and one test batch, each with 10000 images. The test batch contains exactly 1000 randomly-selected images from each class. The training batches contain the remaining images in random order, but some training batches may contain more images from one class than another. Between them, the training batches contain exactly 5000 images from each class.
To explore more about CIFAR-10 Dataset | CIFAR-10
The MNIST database (Modified National Institute of Standards and Technology database) is a large database of handwritten digits that is commonly used for training various image processing systems. The database is also widely used for training and testing in the field of machine learning.

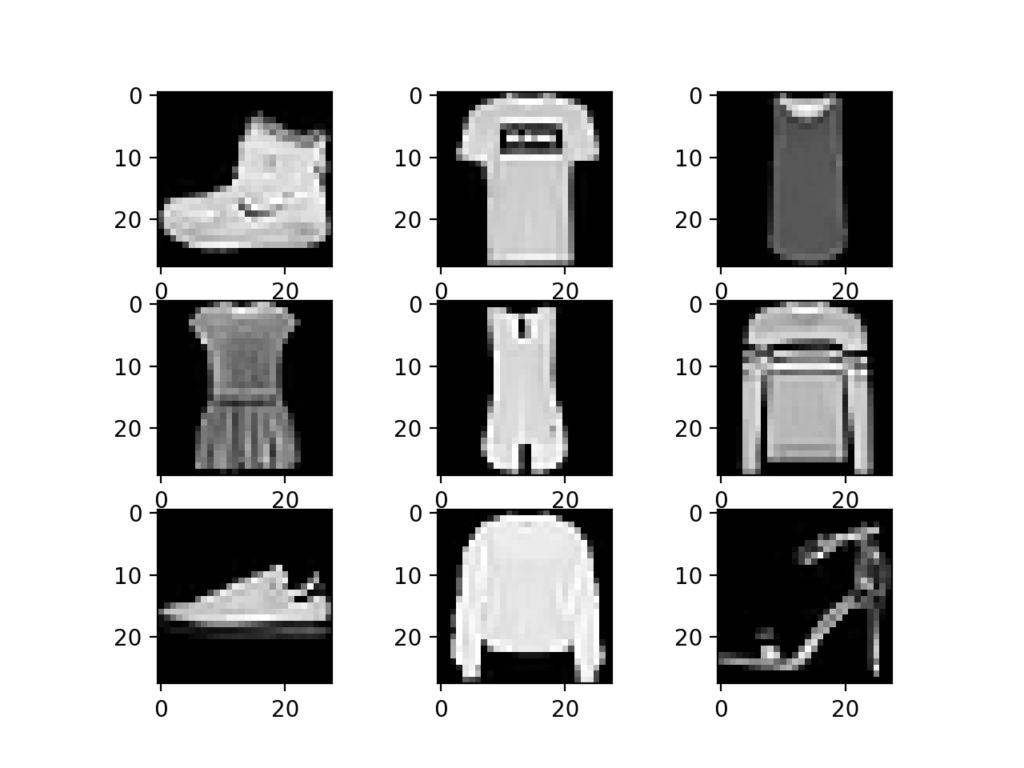
The Fashion MNIST dataset is an alternative to the standard MNIST dataset. Instead of handwritten digits, it contains 70000 28x28 grayscale images of ten types of fashion items.


