This project is designed to help monitor the status of servers by checking the list of server ports and inserting the server status into an Elastic Search index. The project is written in Python and utilizes Elastic Search integration to store and retrieve data.
The program works by first retrieving a list of server ports that need to be monitored. It then checks the status of each server port and records whether it is up or down. This information is then inserted into an Elastic Search index, which can be used for further analysis or monitoring.
The Elastic Search index provides a centralized location for storing and retrieving data related to server statuses. This allows for easy access to historical data, as well as real-time monitoring of server statuses.
Overall, this project provides a simple yet effective solution for monitoring server statuses using Python and Elastic Search integration.
- Python 3.x
- Docker (optional, if you want to use the provided Docker images)
- Elasticsearch API key (obtain from your Elasticsearch provider)
- Open the
config.pyfile located in the project's root directory. - Obtain a list of servers and their corresponding ports.
- Update the
end_pointsparameter in the config.py file with the obtained server information. Use the provided sample format as a reference.
- Obtain an Elasticsearch API key from your Elasticsearch provider.
- update the values of elastic in docker-compose
- If you want to use the provided Docker images, skip this step. Otherwise, proceed to build your own Docker images.
- Execute the following command to build the Docker images:
docker build -t your_image_name .
- Open the docker-compose.yml file located in the project's root directory.
- Set any necessary environment variables such as port mappings or volume configurations. Customize them according to your requirements.
- Execute the following command to start the application using Docker Compose:
docker-compose up -d
This command will start the application in detached mode.
This project is designed to function in various environments and is specifically tailored for production. You can monitor the status of the services it provides.
This project integrates with ElasticSearch to check the list of server ports and insert the server status on the ElasticSearch index.
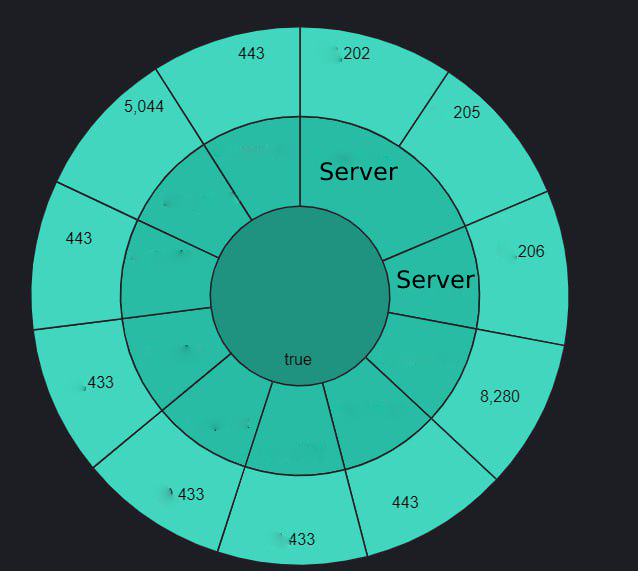
Below is a visual representation of the Kibana dashboard showcasing the port status.
This project is licensed under the MIT License. Feel free to use, modify, and distribute it as per the terms of the license.
