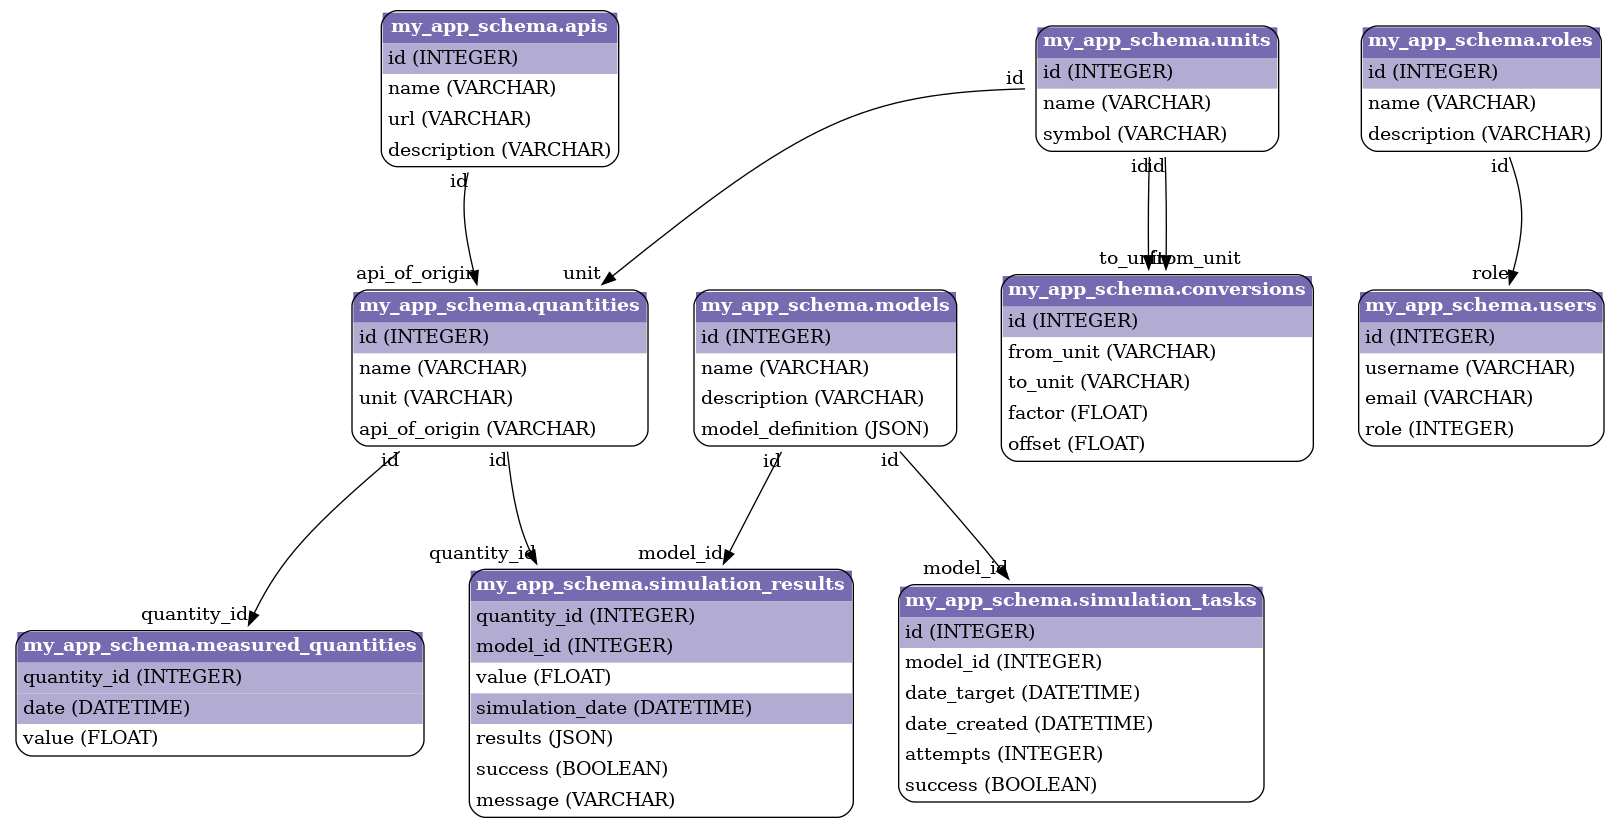
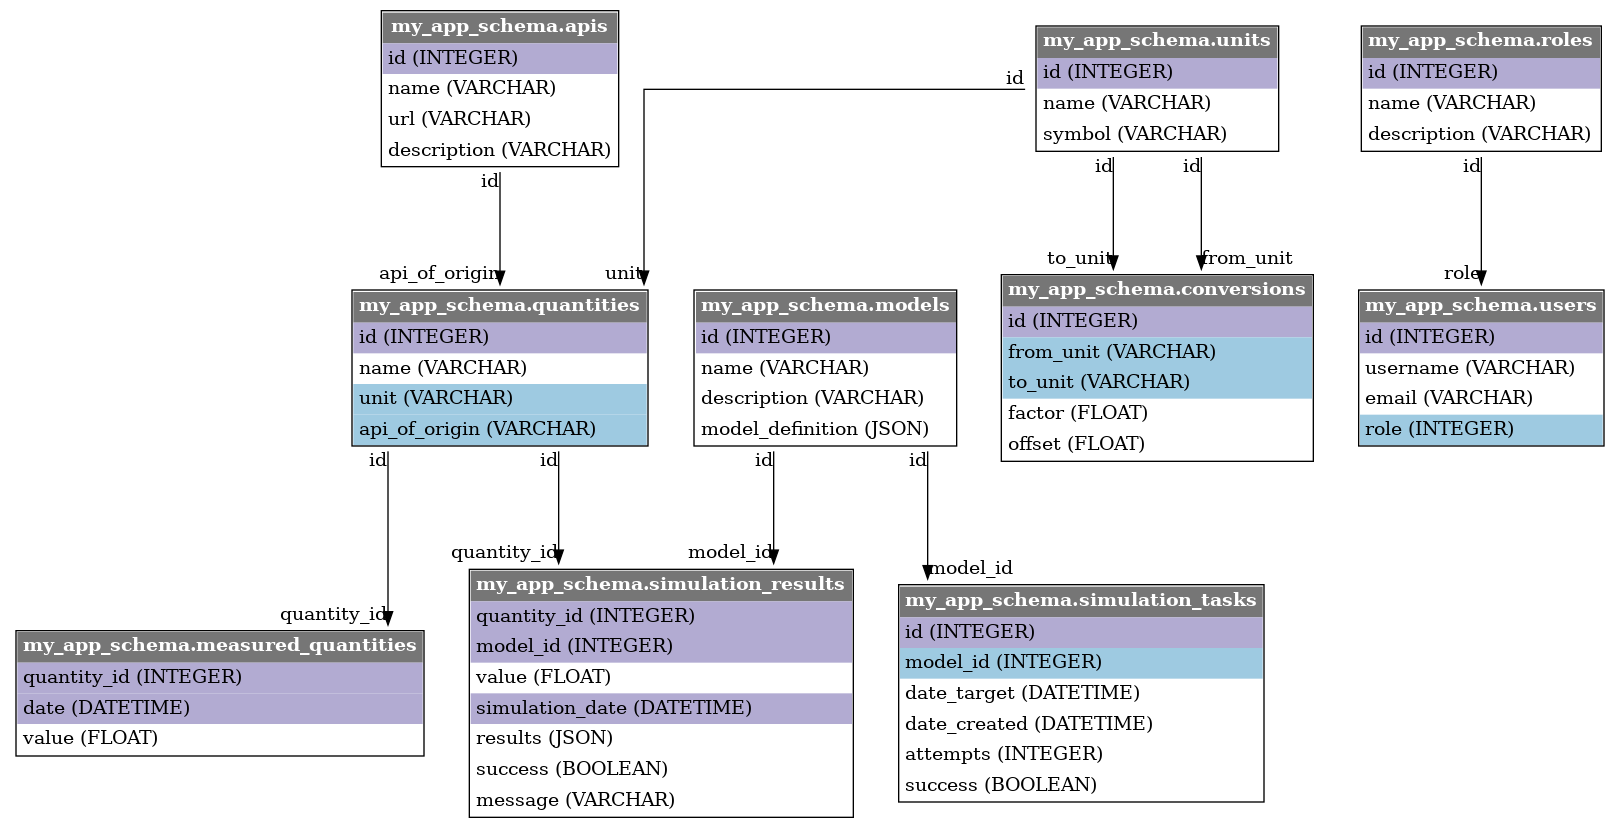
A module to display sqlalchemy database tables and keys as a graph. Inspired by https://pypi.org/project/sqlalchemy-schemadisplay/.
license: MIT license
Generate graphs from your sqlalchemy declarative database in one simple function call.
How to use:
from sqlalchemy_db_graphing import generate_graph_as_png
from mymodule.database_schema import MySQLAlchemySchema

filename = "path/to/save/file.png"
generate_graph_as_png(metadata=MySQLAlchemySchema.metadata, filename=filename)
generate_graph_as_png also supports arguments:
style_options: either a string referring to a style preset, or a dictionary of options defining the style of each graphviz node. Keys are: -table_style: Style of each table (table element). -table_name_style: Style of the table name (font element). -header_style: Style of the table headers (td element). -schema_name_style: Style of the schema name (font element). -pk_style: Style of a column identified as a primary key (td element). -fk_style: Style of a column identified as a foreign key (td element). -pk_fk_style: Style of a column identified as both a primary and foreign key (td element). -column_style: Style of all other columns (td element). -legend_style: Style of the legend (table element).display_legend: whether the legend is displayed or not.
Style options dict example (Default style):
{
    "table_style": "cellborder='1' cellspacing='0' cellpadding='4' border='1' style='rounded'",
    "table_name_style": "color='red'",
    "header_style": "align='center' bgcolor='grey' border='0'",
    "schema_name_style": "color='black'",
    "pk_style": "align='left' bgcolor='#99CCFF' border='0'",
    "fk_style": "align='left' bgcolor='#CCFF99' border='0'",
    "pk_fk_style": "align='left' bgcolor='#99CCFF' border='0'",
    "column_style": "align='left' border='0'",
    "legend_style": "border='0' cellpadding='2' cellspacing='0'"
}
Finally, all graphviz keyword arguments are supported, see https://graphviz.org/docs/graph/ for a comprehensive list.
generate_graph_as_png(
        metadata=MySQLAlchemySchema.metadata,
        filename=filename,
        style_options="blue_rounded",
        display_legend=False,
        rankdir="LR",  # Draw the graph from Left to Right instead of Top Down.
        splines = "ortho",
)generate_graph_as_png(
metadata=MySQLAlchemySchema.metadata,
filename=filename,
style_options="purple_rounded",
display_legend=False,
rankdir="TD",
splines = "curved",
)generate_graph_as_png(
metadata=MySQLAlchemySchema.metadata,
filename=filename,
style_options="purple_blue",
display_legend=False,
rankdir="TD",
splines = "curved",
)The module also includes a few other functions:
generate_graph_as_svgfor svg pictures generation.generate_graph_as_pydotto get a pydot representation of your declarative base.get_schema_metadata_from_live_databaseto retrieve the metadata from a live database instead of the declarative database
Example with live database:
from sqlalchemy_db_graphing import get_schema_metadata_from_live_database

database_url = f"postgresql+psycopg2://username:password@host:port/db_name"
metadata = get_schema_metadata_from_live_database(url=database_url, schema="my_app_schema")This package was created with Cookiecutter and the audreyr/cookiecutter-pypackage project template.
- Cookiecutter: https://github.com/audreyr/cookiecutter
audreyr/cookiecutter-pypackage: https://github.com/audreyr/cookiecutter-pypackage


