-
Notifications
You must be signed in to change notification settings - Fork 11.9k
New issue
Have a question about this project? Sign up for a free GitHub account to open an issue and contact its maintainers and the community.
By clicking “Sign up for GitHub”, you agree to our terms of service and privacy statement. We’ll occasionally send you account related emails.
Already on GitHub? Sign in to your account
Horizontal Bars mix with lines #4096
Comments
|
@joaofiliperocha do you have a test case that reproduces this issue? |
|
I also want to draw a horizontal bar chart mixed with a line chart, using data like this: week, bar, line could you please help with a sample code? Thanks. |
|
@joaofiliperocha. I think that you can't plot a line chart mixed with a horizontalBar, because we don't have an "horizontalLine" chart type. @lwlwlwlw Try this sample. @etimberg |
|
+1 |
|
I found this .. hope it helps |
|
Ok @joaofiliperocha, to make this with Chart.js see this: http://stackoverflow.com/questions/30256695/chart-js-drawing-an-arbitrary-vertical-line |
|
Here is a codepen that demonstrates the issue, if that is useful: |
|
@etimberg So is this ever going to be supported? The website advertises Mixed charts... that gives the impression you can mix more then a handful of predefined mixes |
|
It would be a great thing to have vertical lines, too |
|
mixed chart still doesn't support horizontalBar + line yet? |
|
No, verticalLines would be required, but there are none. |
|
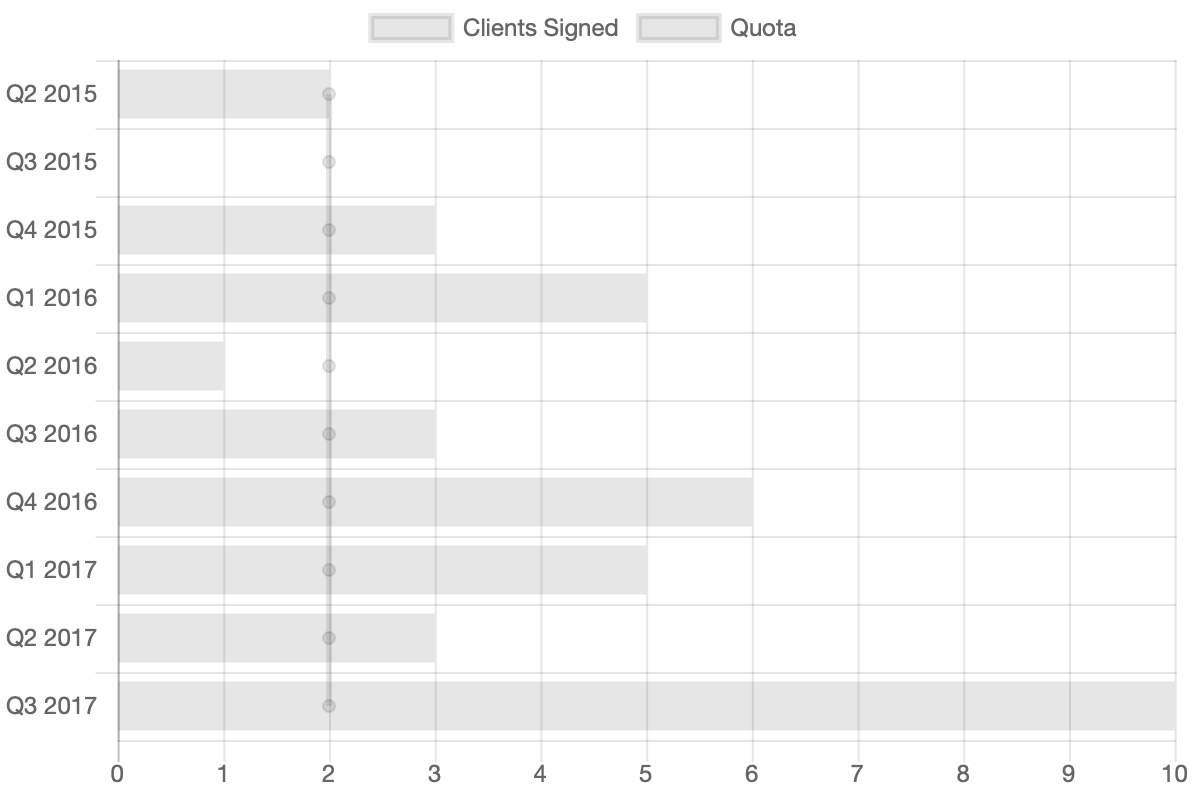
If you use data: {
datasets: [{
label: "Clients Signed",
data: [2, 0, 3, 5, 1, 3, 6, 5, 3, 10]
}, {
label: 'Quota',
data: [{x: 2, y: 'Q2 2015'}, {x: 2, y: 'Q3 2015'}, {x: 2, y: 'Q4 2015'}, {x: 2, y: 'Q1 2016'}, {x: 2, y: 'Q2 2016'}, {x: 2, y: 'Q3 2016'}, {x: 2, y: 'Q4 2016'}, {x: 2, y: 'Q1 2017'}, {x: 2, y: 'Q2 2017'}, {x: 2, y: 'Q3 2017'}],
type: 'line'
}],
labels: ['Q2 2015', 'Q3 2015', 'Q4 2015', 'Q1 2016', 'Q2 2016', 'Q3 2016', 'Q4 2016', 'Q1 2017', 'Q2 2017', 'Q3 2017']
} |
|
What's the status of this, seems that the work-a-round (https://codepen.io/johnpitchko/pen/OjzGrr.) is not working anymore? |
|
@wuahi That one was never working, look at the post above you. You still have to replace it :) The trick for lines is this part:
instead of just giving a value, you're giving an object with x as the value and y the label |

Expected Behavior
Horizontal Bars mix with line
Current Behavior
I have vertical bar with mix line chart, when it changes the type to horizontal bar the other dataset desapear
The text was updated successfully, but these errors were encountered: