RGB band selection, Matplotlib colormaps, and thumbnails
This release adds support for three new features:
- Choose which bands to use for RGB channels when tile serving
- Generate thumbnails with the same styling parameters as tile serving
- Use any Matplotlib colormap as a
palettechoice
Example
There is a new example in the README to demonstrate RGB channel selection:
from localtileserver import get_leaflet_tile_layer, TileClient
from ipyleaflet import Map, ScaleControl, FullScreenControl, SplitMapControl

# First, create a tile server from local raster file
tile_client = TileClient('landsat.tif')

# Create 2 tile layers from same raster viewing different bands
l = get_leaflet_tile_layer(tile_client, band=[7, 5, 4])
r = get_leaflet_tile_layer(tile_client, band=[5, 3, 2])

# Make the ipyleaflet map
m = Map(center=tile_client.center(), zoom=12)
control = SplitMapControl(left_layer=l, right_layer=r)
m.add_control(control)
m.add_control(ScaleControl(position='bottomleft'))
m.add_control(FullScreenControl())
m
Thumbnails
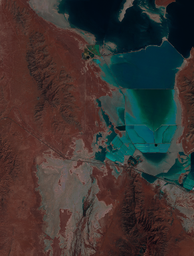
and you can also generate styled thumbnails with
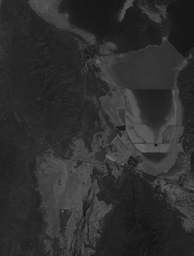
tile_client.thumbnail(band=[5, 3, 2], output_path='thumbnail_styled.png')as opposed to the default channels:
tile_client.thumbnail(output_path='thumbnail_default.png')Matplotlib Colormaps
and you can plot any single band with a matplotlib colormap by:
l = get_leaflet_tile_layer(tile_client, band=7, palette='rainbow')


m = Map(center=tile_client.center(), zoom=10)
m.add_layer(l)
m


