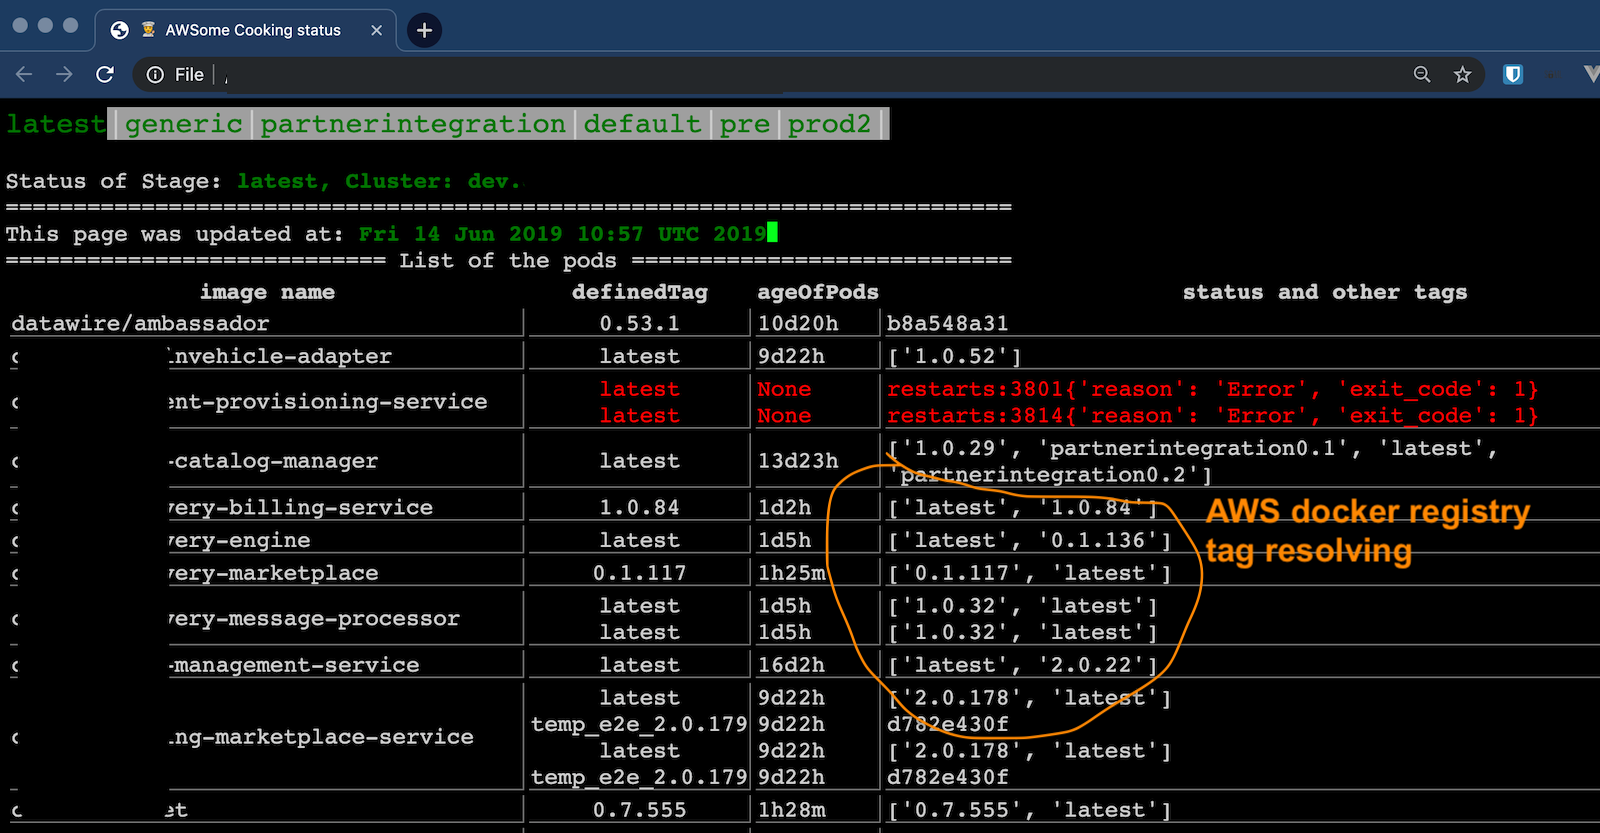
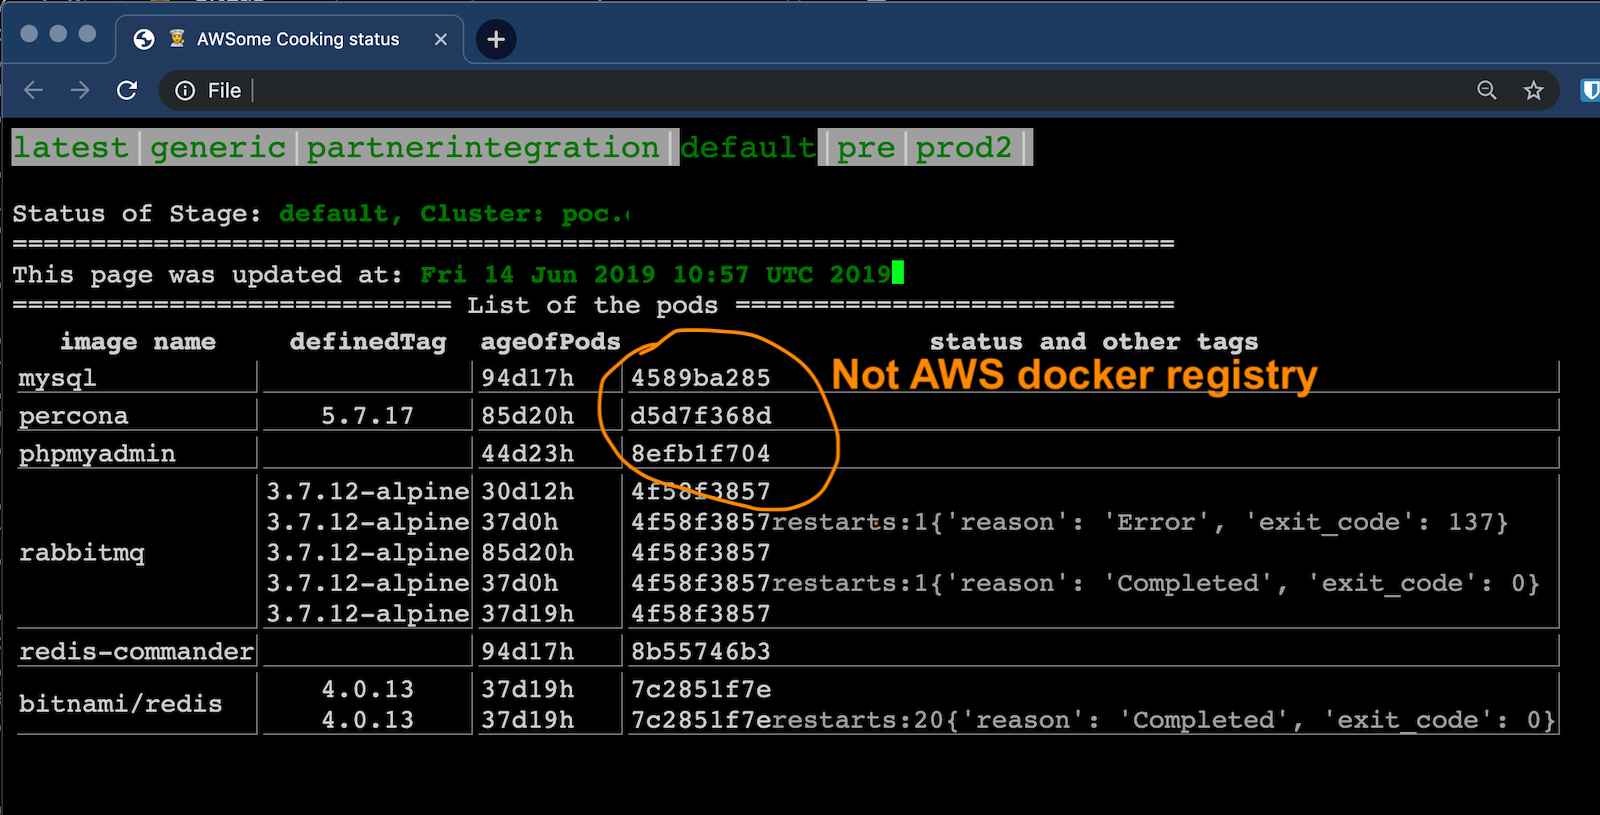
Since we have here a number of clusters and environments, I manage to build a little python dashboard. It just generate a static html file with all interesting things running around. You can instantly see what is going on like:
- who is restarting
- what is the reason (OOM killed etc...)
- docker image names
- other docker tags pointing on the same checksum (work only with AWS docker registry)
- modify config.yml
- make sure your host is connected to kubernetes (check ~/.kube)
- also connected to aws (~./aws)
- pip3 install poetry
- poetry install
- poetry shell
- ./fetch out.json
- ./render html.pug out.json status.html
- open status.html
- ./server.sh
- open browser http://127.0.0.1:5500/
- press Ctrl+C in terminal to quit
- server automatically tell browser to refresh page when out.json changes
- server.sh fetches out.json content from k8s clusters and resole docker tags every 20 seconds