Comparison of different historical magnetographs to illustrate the data-space of the super-resolution challenge on FDL 2019.
Requirements:
- Python 3.7+ installation.
- Astropy package.
- SunPy package.
You can find instructions for anaconda installation here:
- Anaconda Windows installation instructions.
- Anaconda Mac-OS installation instructions.
- Anaconda Linux installation instructions.
- Start a terminal. You can find instructions for opening terminals here:
- Run the following commands. They will update your python environment and install astropy and sunpy.
conda config --add channels conda-forge
conda install sunpy
Click on the Clone or download button and clone it to a repository or download it as a zip file.
If you want help cloning the repository and don't know how to do it let me know. Otherwise, simply download the files and unpack them on a folder in your computer.
-
Open a terminal (see above).
-
Navigate to the folder where you unzipped the repository. Here are some quick tutorials to use the terminal:
- Run the following command:
jupyter notebook --NotebookApp.iopub_data_rate_limit=10000000000
The jupyter notebook command is normally sufficient, but the visualizations I'm including have a data rate limit to high for the defaults. There is a way of fixing this permanently, but you need to mess up with configuration files. More here:
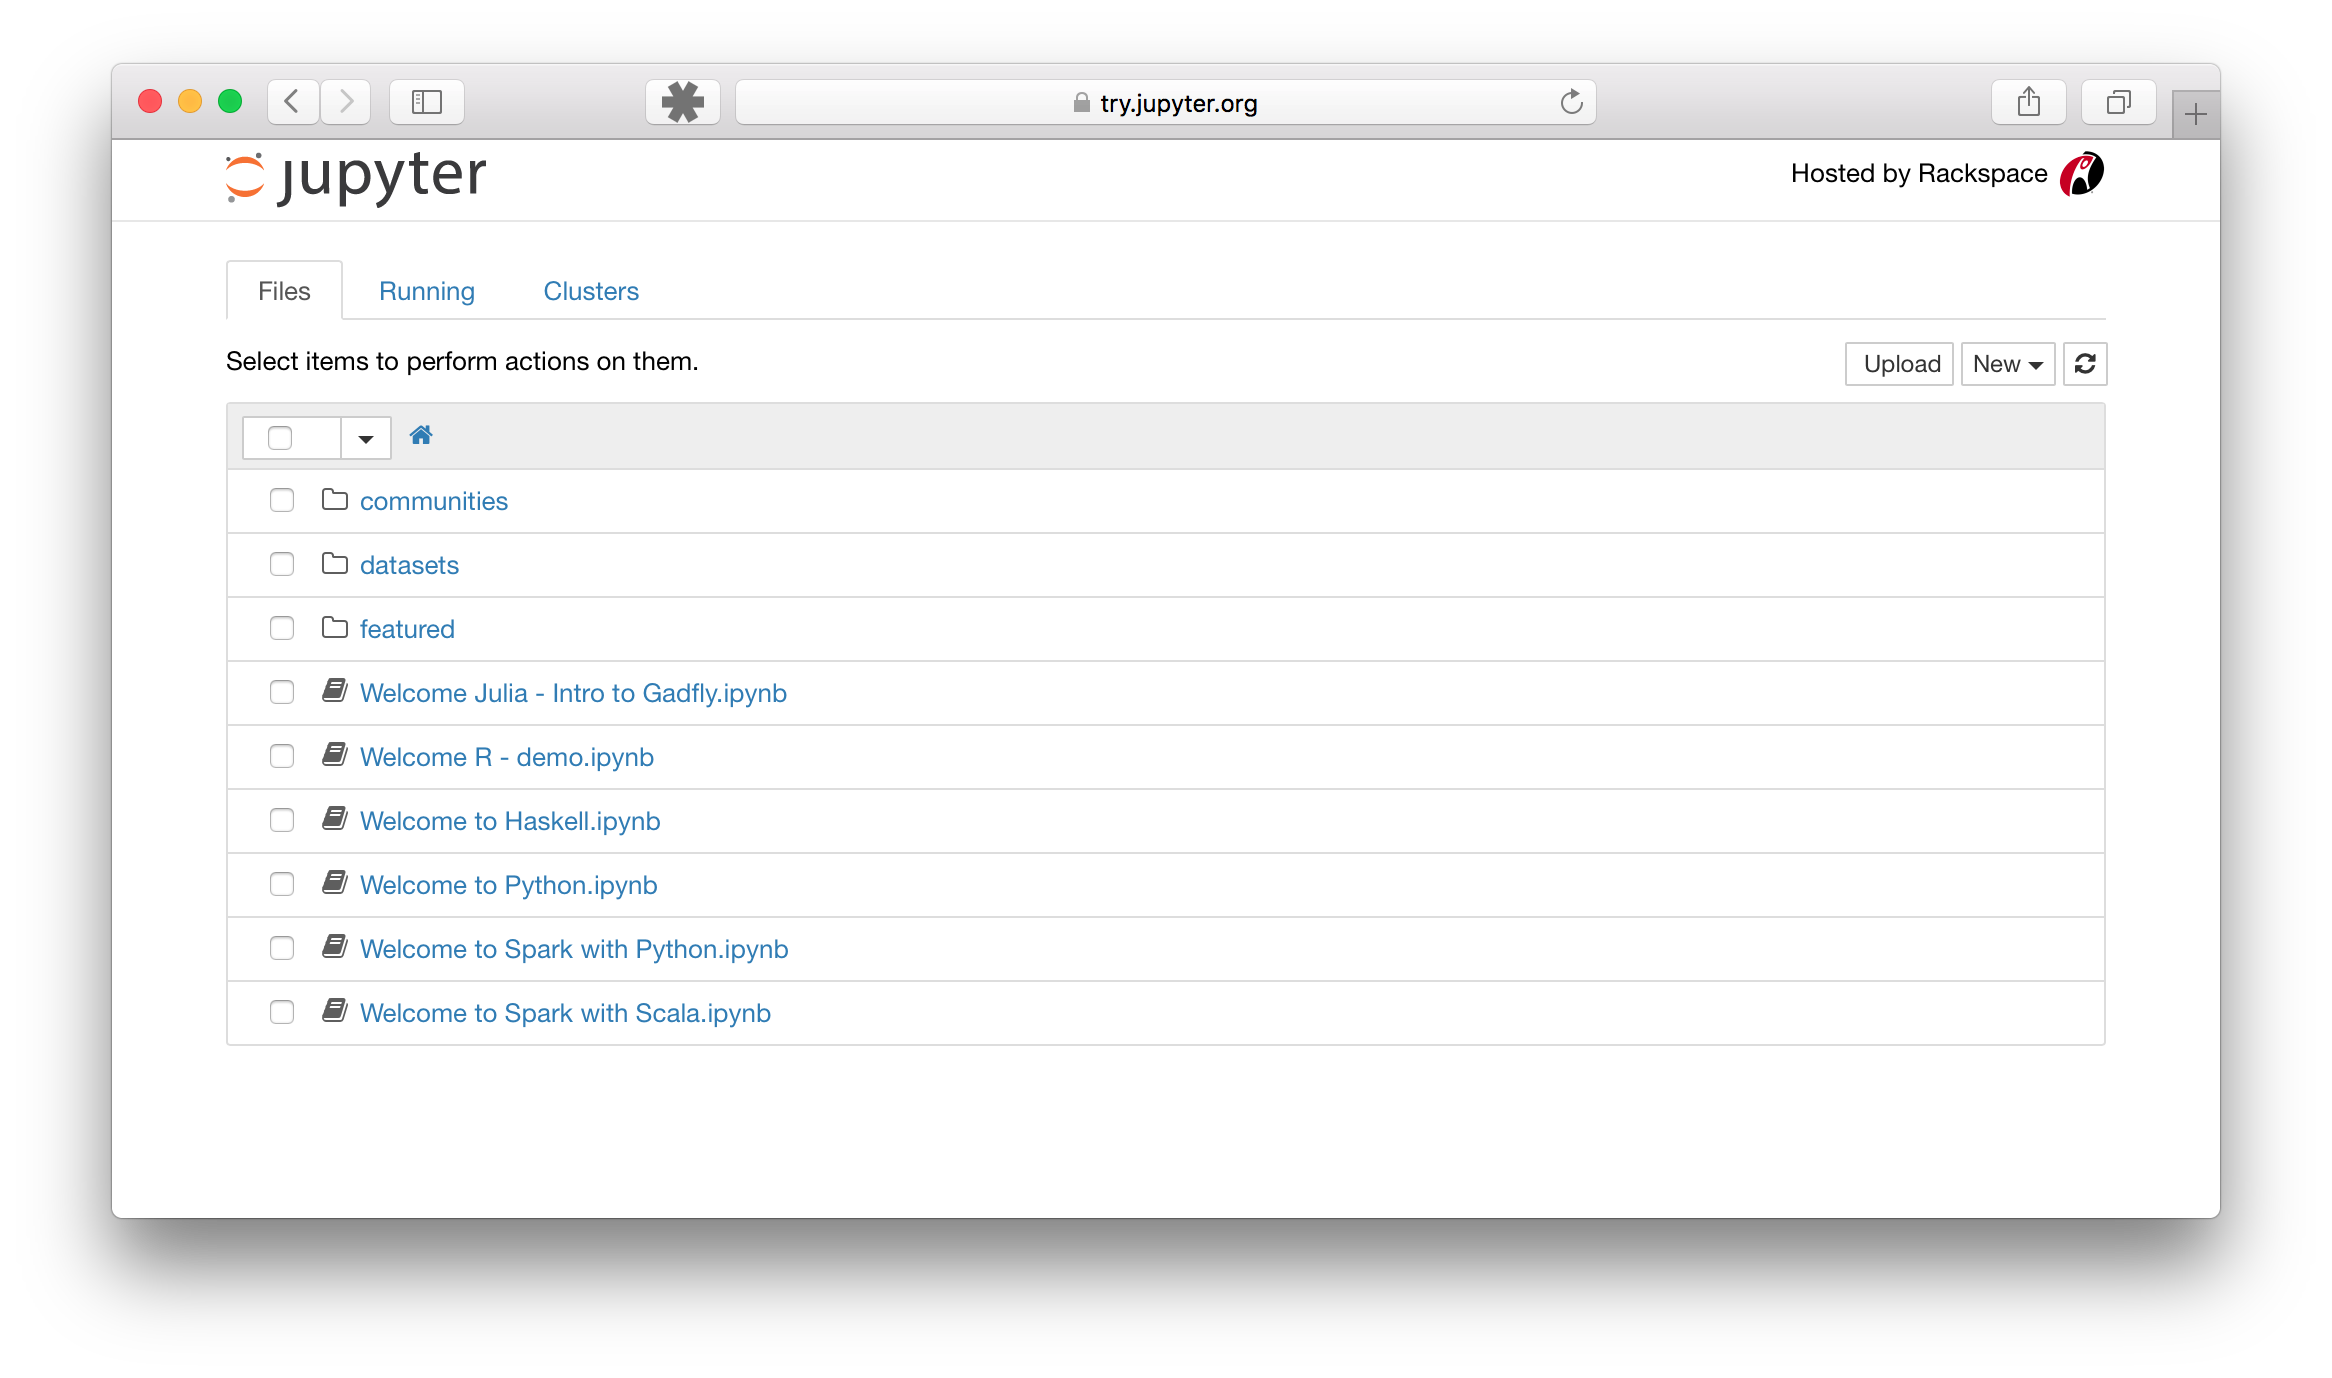
- Open the notebook. Launching jupyter should open the dashboard in your folder. Something that looks like this:
Click on the notebook you want to open.
- Run all cells or the cells you want. For more information about running cells please see:
More information about the Jupyter notebook can be found here:

