Wireless Telecommunications
My Linkedin
In wireless telecommunications, the signal strength decreases or attenuates during transmission, especially over long distances. The attenuation increases exponentially with the distance between the transmitter and the receiver. This report attempts to assist in estimating the attenuation in different conditions. One common model for path loss estimation is the Path Loss Exponent and Shadowing Gaussian Noise models in urban environments, which we will explore using machine learning techniques.
- Python
- sklearn
- pandas
- numpy
- matplotlib
- IPhone 8
- Network Cell Info Lite
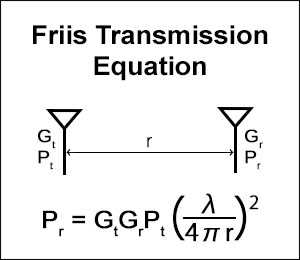
In telecommunications engineering, the Friis equation, also known as the free space path loss (FSPL) equation, is used to calculate the power received by an antenna at a certain distance from a transmitting antenna. The equation depends on factors like transmitted power (Pt), transmitting antenna gain (Gt), receiving antenna gain (Gr), and distance (d).
To calculate the path loss (PL) and power received (Pr), we can simplify the Friis equation as follows:
or in logarithmic form:
where the path loss is:
Further simplifying, we get:
Here,
| Parameter | Description |
|---|---|
| the reference received power | |
| reference distance | |
| Gaussian noise with standard deviation between 4 and 12 |
The goal of this project is to estimate the parameters
We collected data by measuring signal quality between a mobile phone and three base stations, including both line-of-sight (e.g., streets) and non-line-of-sight locations (e.g., parks). Sampling was done every second during movement, with 81 data samples collected. Figure 1 shows a map of the sample points and base stations, indicating locations where signal quality deteriorated due to obstructions such as buildings and narrow streets. The data was gathered from 3 separate base stations.
Figure 1: Route map and sampling of base stations along with color display of signal qualityBy applying regression techniques to the collected data, we estimated the reference received power
By fitting a curve to the signal strength data, we estimate the path loss coefficient
and the noise standard deviation
The gathered data and python scripts are all provided here
E. D. O. Shoewu, L. Akinyemi, J. Emagbetere, and F. Edeko, "Path loss in Nigerian rural vegetation area: A case study in Igbaraoke, Ondo state," November 2014.

