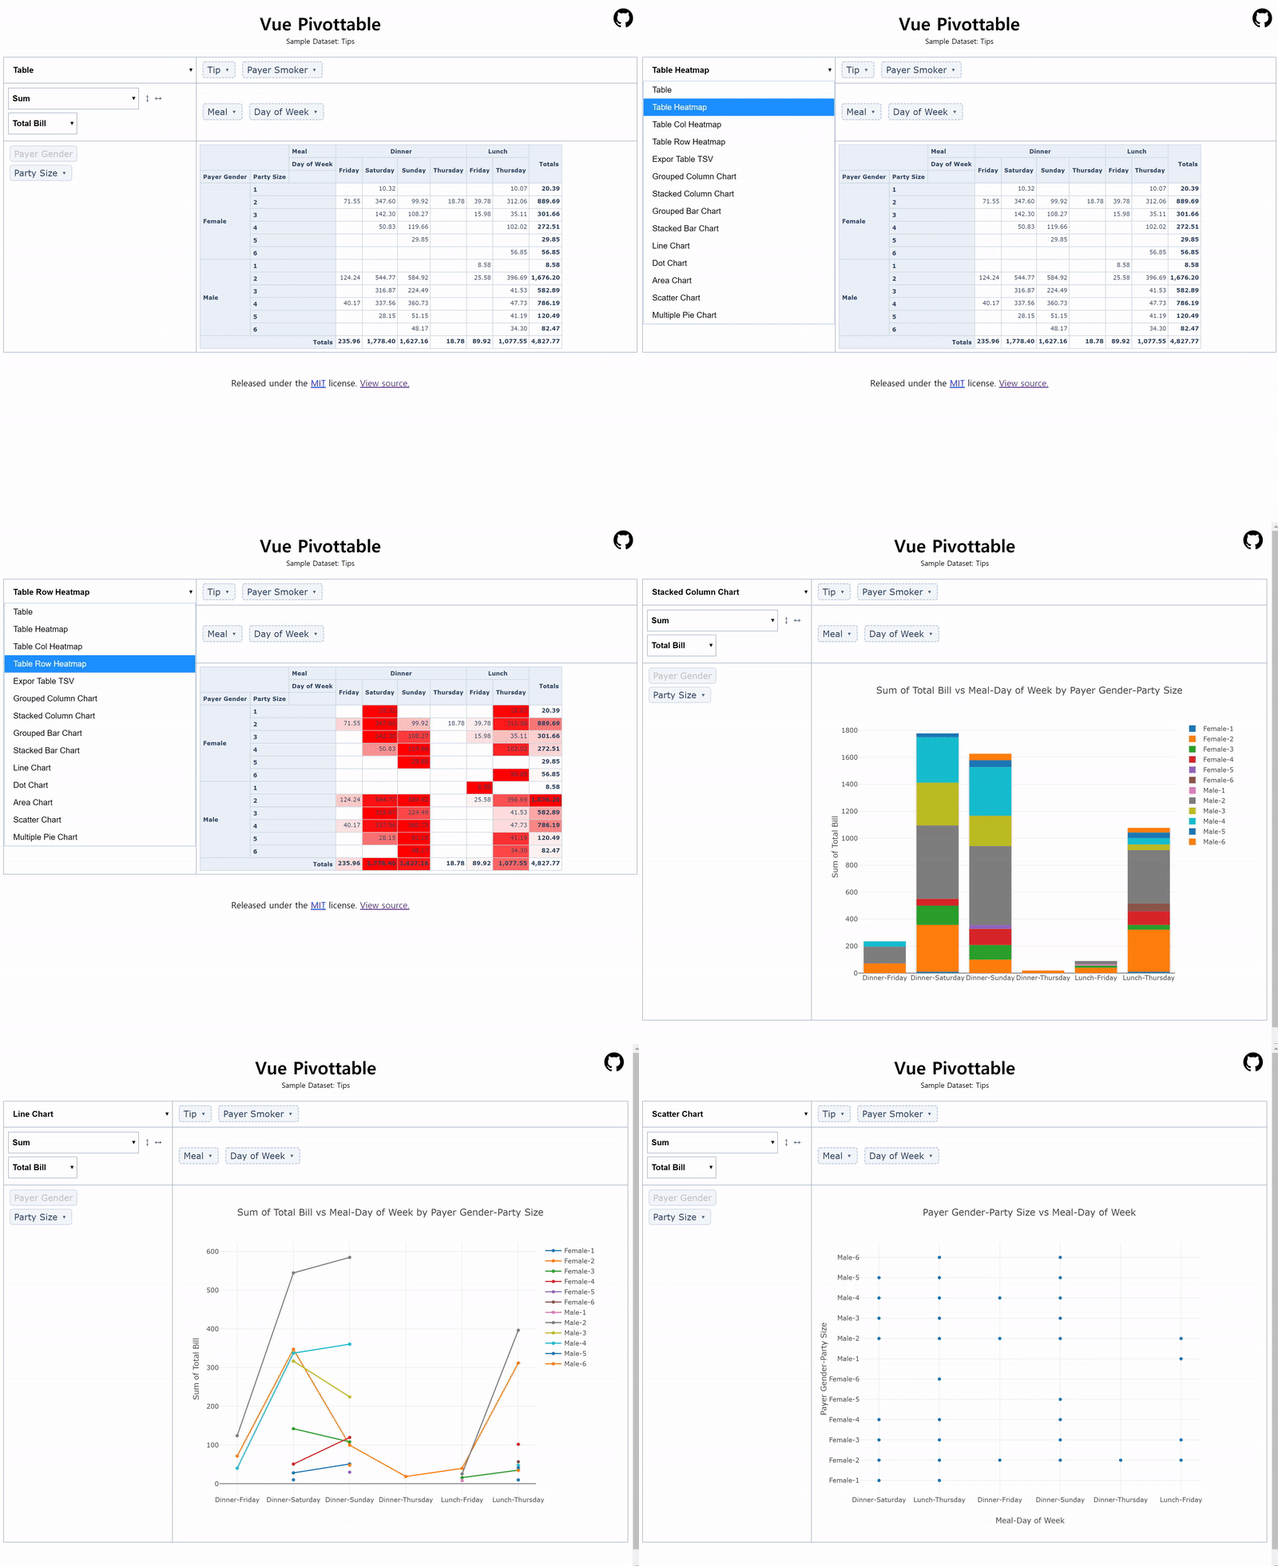
It is a Vue port of the jQuery-based PivotTable.js
You can view the documentation at https://seungwoo321.github.io/vue-pivottable.
It's also lighter by removing vue-plotly from the dependencies.
# Clone the project
git clone https://github.com/Seungwoo321/vue-pivottable.git

# Go into the cloned directory
cd vue-pivottable/example/

# npm install
npm install

# npm run serve
npm run serve
Open browser to http://localhost:8080
npm i vue-pivottable
- Vue Pivottable
<template>
  <vue-pivottable
    :data="[{color: 'blue', shape: 'circle'},{color: 'red', shape: 'triangle'}]"
    :rows="['color']"
    :cols="['shape']"
  >
  </vue-pivottable>
</template>

<script>
import { VuePivottable } from 'vue-pivottable'
import 'vue-pivottable/dist/vue-pivottable.css'
export default {
  components: {
    VuePivottable
  }
}
</script>- Vue Pivottable Ui
<template>
  <vue-pivottable-ui
    :data="[{color: 'blue', shape: 'circle'},{color: 'red', shape: 'triangle'}]"
    :rows="['color']"
    :cols="['shape']"
  >
  </vue-pivottable-ui>
</template>

<script>
import { VuePivottableUi } from 'vue-pivottable'
import 'vue-pivottable/dist/vue-pivottable.css'
export default {
  components: {
    VuePivottableUi
  }
}
</script>-
Plotly renderer
<template>
  <vue-pivottable-ui
    :data="[{color: 'blue', shape: 'circle'},{color: 'red', shape: 'triangle'}]"
    renderer-name="Area Chart"
    :rows="['color']"
    :cols="['shape']"
    :renderers="renderers"
  >
  </vue-pivottable-ui>
</template>

<script>
import { VuePivottableUi } from 'vue-pivottable'
import PlotlyRenderer from '@vue-pivottable/plotly-renderer'
import 'vue-pivottable/dist/vue-pivottable.css'
export default {
  components: {
    VuePivottableUi
  },
  computed: {
    renderers () {
      return (() => ({
        'Grouped Column Chart': PlotlyRenderer['Grouped Column Chart'],
        'Stacked Column Chart': PlotlyRenderer['Stacked Column Chart'],
        'Grouped Bar Chart': PlotlyRenderer['Grouped Bar Chart'],
        'Stacked Bar Chart': PlotlyRenderer['Stacked Bar Chart'],
        'Line Chart': PlotlyRenderer['Line Chart'],
        'Dot Chart': PlotlyRenderer['Dot Chart'],
        'Area Chart': PlotlyRenderer['Area Chart'],
        'Scatter Chart': PlotlyRenderer['Scatter Chart'],
        'Multiple Pie Chart': PlotlyRenderer['Multiple Pie Chart']
      }))()
    }
  }
}
</script>Seungwoo321 💻 |
rkota 🚧 |
Jayraj Rathwa 🐛 |
cbbdev 🚧 |
- plotly/react-pivottable - React-based pivot table library
- David-Desmaisons/vue-plotly - vue wrapper for plotly.js
MIT

