Visit my Online Portfolio
Data:
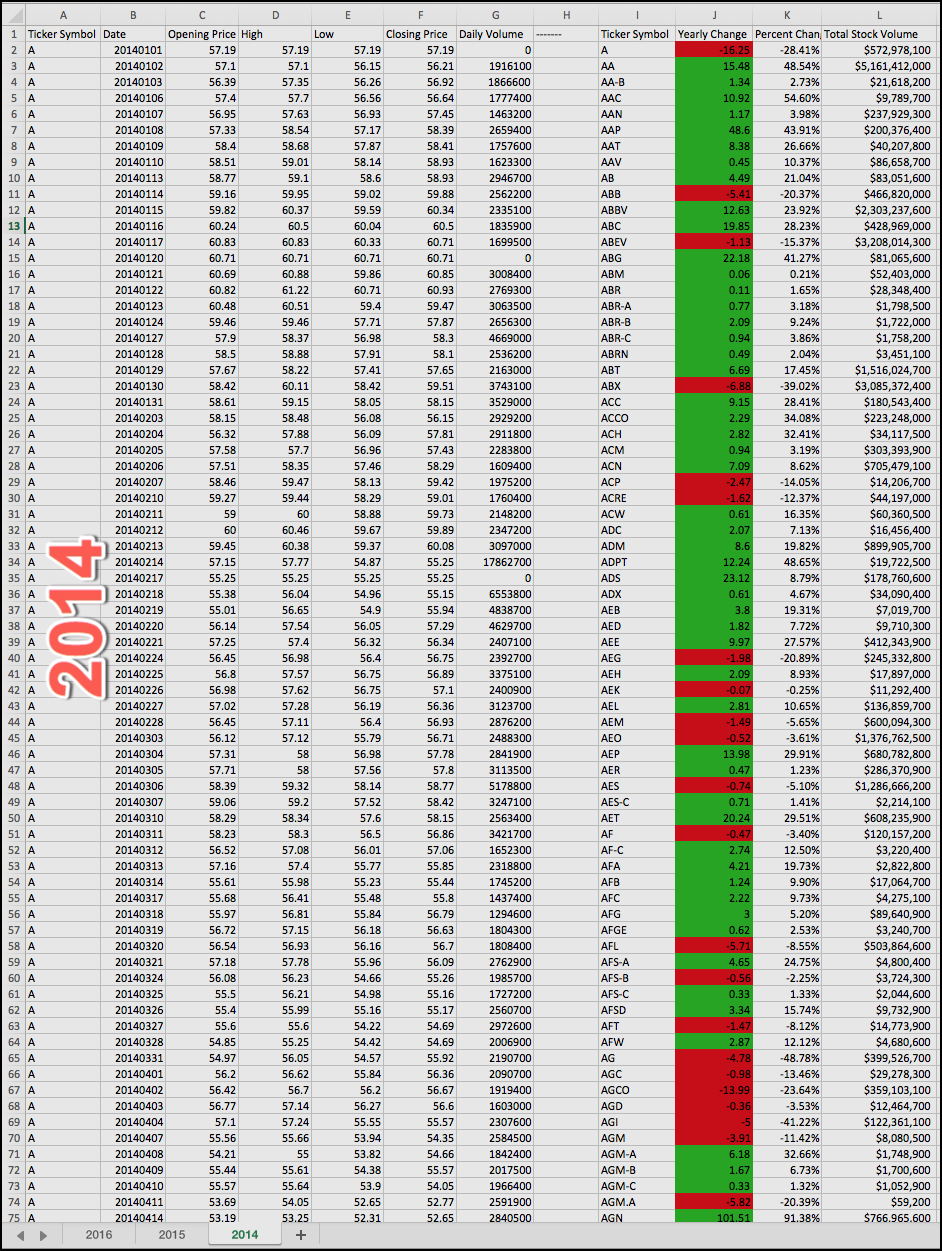
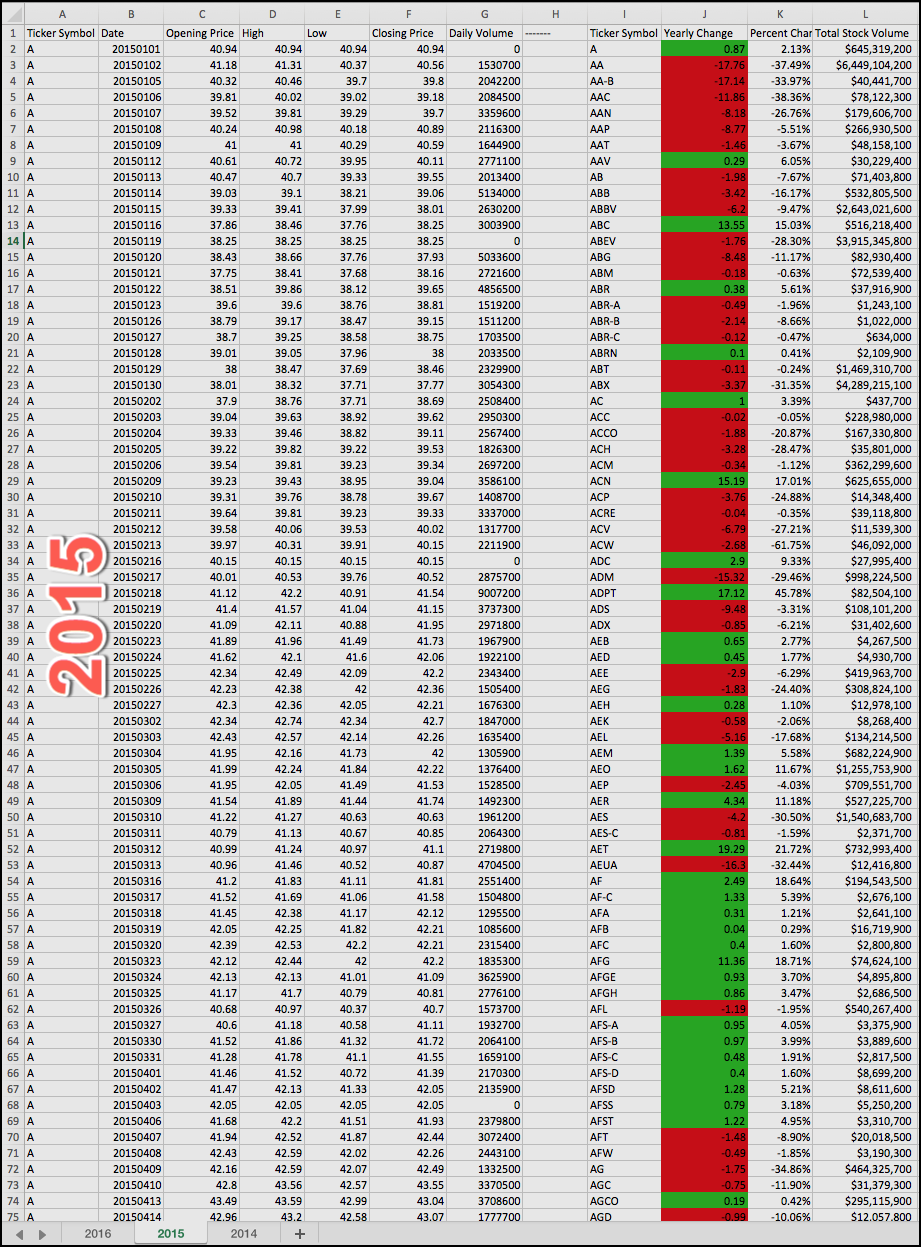
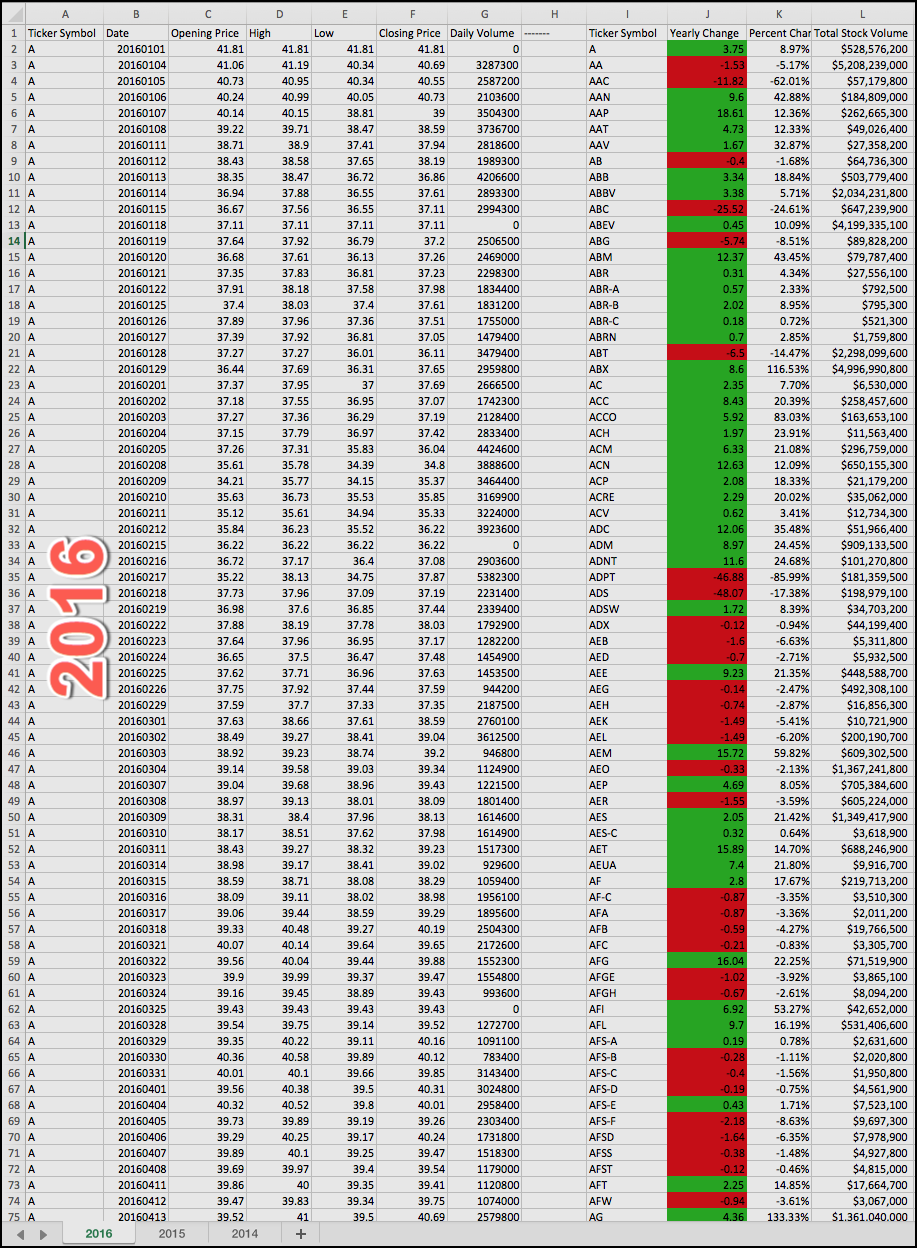
- Provided with an excel sheet containing about 71,000 rows of WallStreet Data
- Each data entry included the Ticker Symbol, Date, as well as the following daily attributes: Opening Price, Closing Price, Highest Price, Lowest Price, and Volume.
Project:
A VBA (Visual Basic for Applications) script was developed to loop through all stocks and create a column for:
- Total Volume of each Stock’s Sales throughout the year,
- Stock’ Ticker Symbol,
- Yearly Price Change (Opening price to Closing Price),
- Yearly Percent Change (Opening price to Closing Price),
- Greatest & Increase/Decrease,
- Greatest Total Volume.
Summary Excel File Can Be Seen Here:
 |
 |
 |
Conditional formatting was applied to the Excel worksheets seen in the screenshots.

