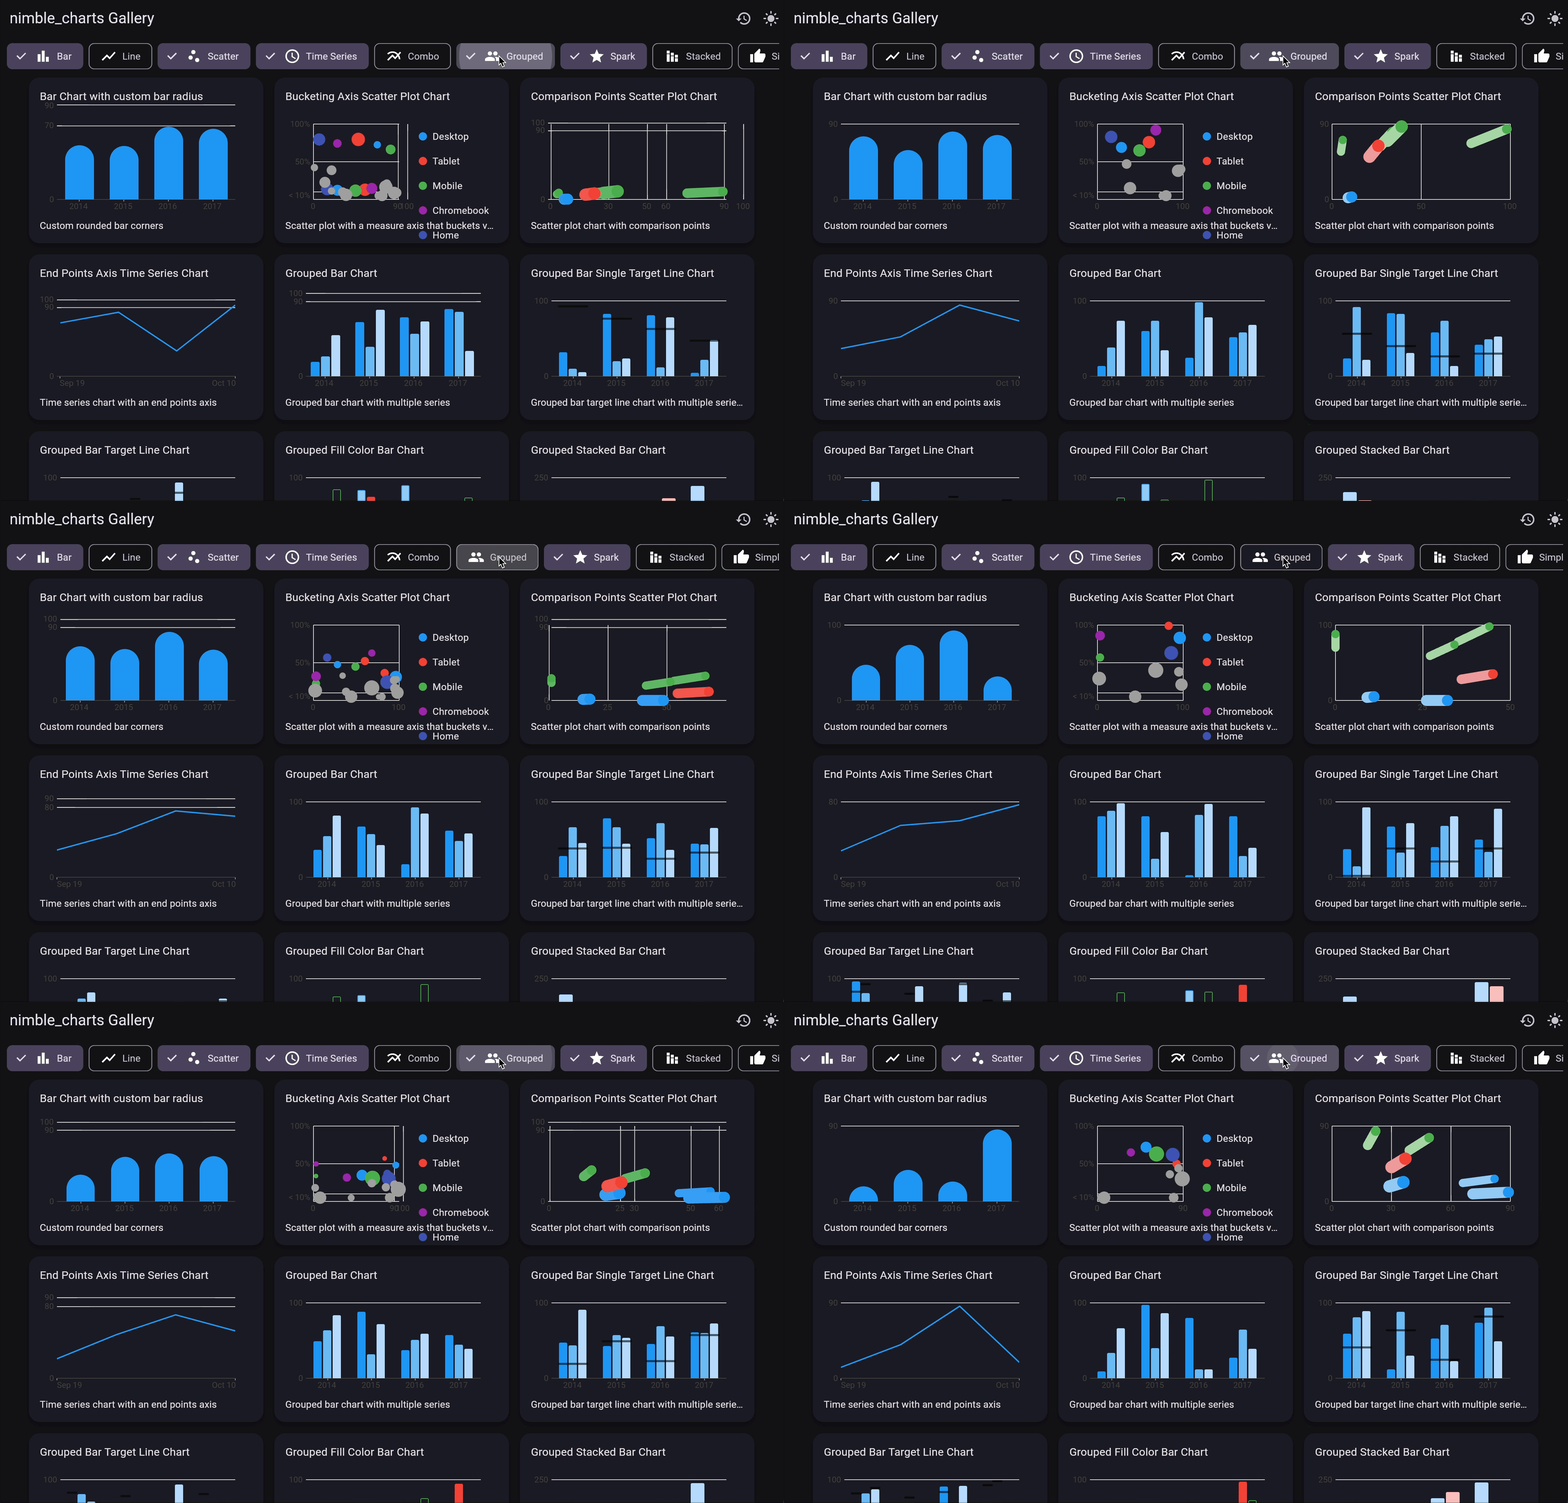
This project is a resurrection of the discontinued charts_flutter. It aims to provide a robust and flexible charting package for Flutter developers. Nimblesite now maintains this library. While the package name has changed, we are working towards making this fork as compatible as possible with the original.
🚀 Live Demo: check out the live WASM web app demo to see the charts in action!
Type safety and rigorous tests ensure that this package is reliable and maintainable. We applied thousands of automatic and manual fixes to the code to bring type safety up, and ensure that it's harder to break this library. There are also many new widget tests with goldens, which means that changes should not affect the UI behavior.
This fork provides the most solid foundation for future development, and we will continue to maintain this library.
Please compare the pubspec.yaml file, analysis_options.yaml file and the test folder with other forks of this library. The difference is clear. This fork only works with Dart 3 and above, which has far better type safety and null safety.
- A wide variety of chart types
- Customizable appearance and behavior
- Flutter-native implementation
- Supports both mobile and web platforms
- Improved documentation and extensive samples
Add the following to your pubspec.yaml:
nimble_charts: ^0.4.0-beta
This is a full app with a basic line chart.
import 'package:flutter/material.dart';
import 'package:nimble_charts/flutter.dart';

typedef LinearSales = ({int year, int sales});

void main() => runApp(
      MaterialApp(
        debugShowCheckedModeBanner: false,
        home: Scaffold(
          body: Padding(
            padding: const EdgeInsets.all(24),
            child: ColoredBox(
              color: Colors.white,
              child: Padding(
                padding: const EdgeInsets.all(24),
                child: LineChart(
                  [
                    Series<LinearSales, int>(
                      id: 'Sales',
                      colorFn: (_, __) => MaterialPalette.purple.shadeDefault,
                      domainFn: (sales, _) => sales.year,
                      measureFn: (sales, _) => sales.sales,
                      data: [
                        (year: 0, sales: 5),
                        (year: 1, sales: 25),
                        (year: 2, sales: 100),
                        (year: 3, sales: 75),
                      ],
                    ),
                  ],
                ),
              ),
            ),
          ),
        ),
      ),
    );
For more examples and detailed documentation, please refer to the example app and documentation.
Contributions are welcome! These are the people who've contributed, and the commit count since the fork.
| Avatar | Username | Commits |
|---|---|---|
| MelbourneDeveloper | 79 | |
| abdushakoor12 | 11 | |
| eseidel | 6 | |
| github-actions[bot] | 4 |
We won't accept new features at this time, but we will accept tests, warning fixes, documentation updates, and bug fixes.
Please pay attention to existing issues and branches before starting work.
Otherwise, please feel free to submit a Pull Request.
This project continues the original Google Charts library under the Apache 2.0 license. We honor the original licenses and attributions. See the LICENSE and AUTHORS files for details. We are grateful to the Google team for their valuable work on this library.
There are many widget tests for the example app. Each of the widget tests create golden files. These golden files are generated with GitHub actions on Linux so they will always be slightly different to your local machine. If you want to run the tests locally, you need to run the following command:
flutter test --update-goldensPlease don't commit goldens in PRs. We will merge your branch to a temporary branch and then run the generate_goldens.yaml action to generate the goldens. If there are changes in the goldens, they will show up in the PR.
The Fork occurred at 0.12.0 of the original charts_flutter
- Migrated all packages to Flutter V3
- Overhauled the code in an attempt to keep the same functionality.
- Uses the austerity package to apply hotfixes and bring type safety to the code.
- While the package may gain new features, we will attempt to keep the functionality in line with the original wherever possible.
- We had to disable many existing tests, but we are working on new widget and integration tests to fill the gap. We will also resurrect many of the old tests when time permits. Until there is sufficient test coverage, the package will remain in beta.
