MitchellGray100@gmail.com https://github.com/MitchellGray100/LinearRegression
JavaFX Tool to find r-squared values and line of best fit.
It's Linear Regression.
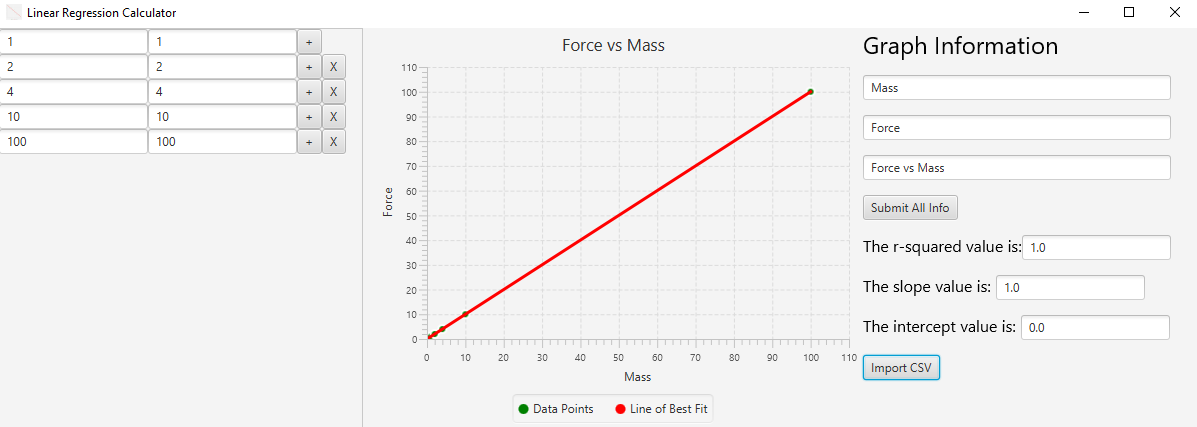
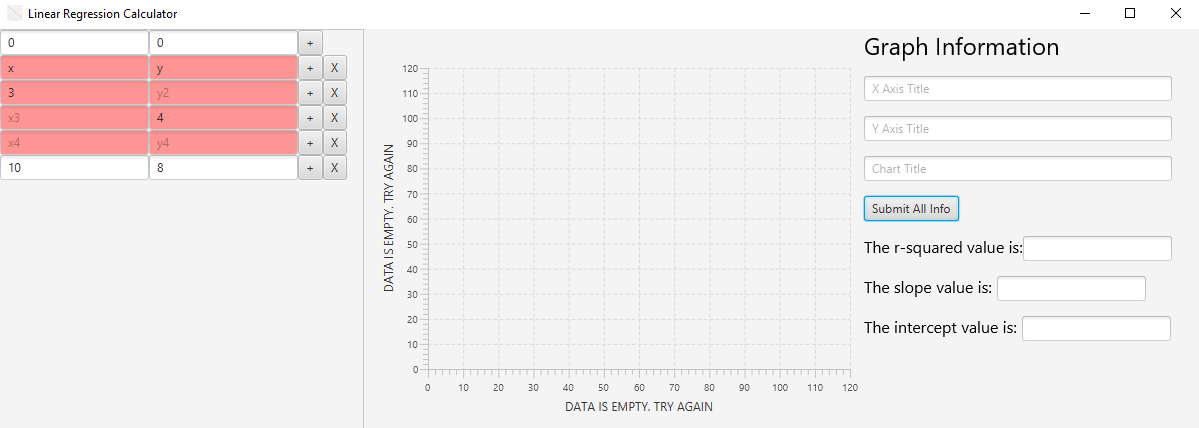
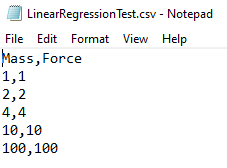
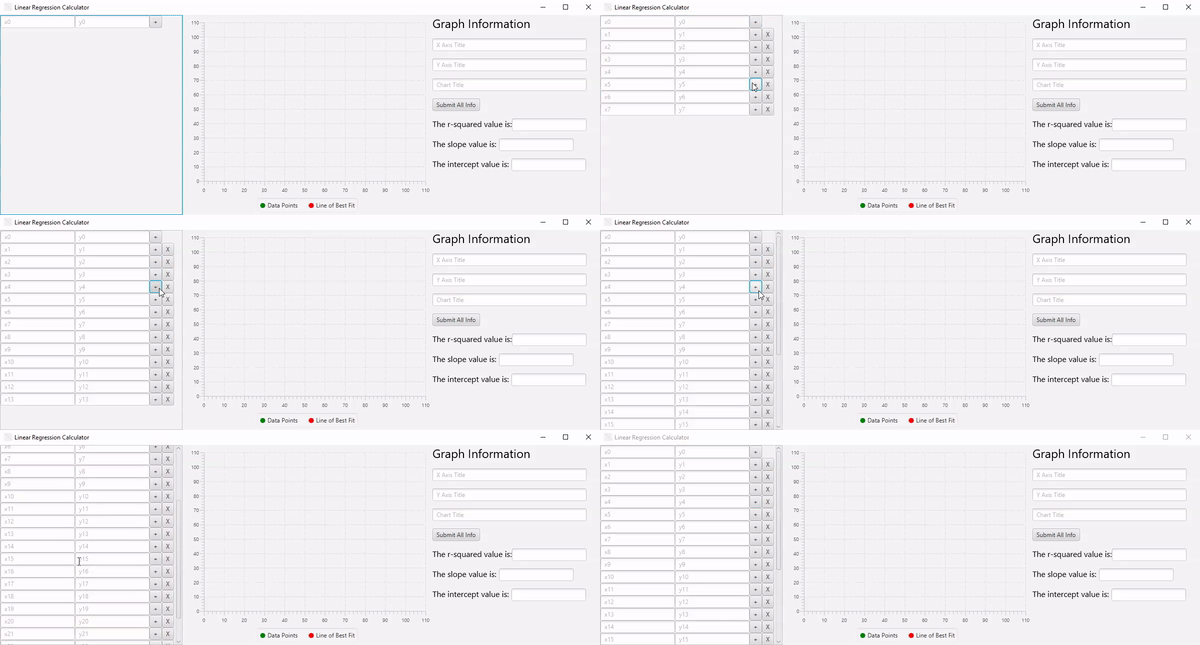
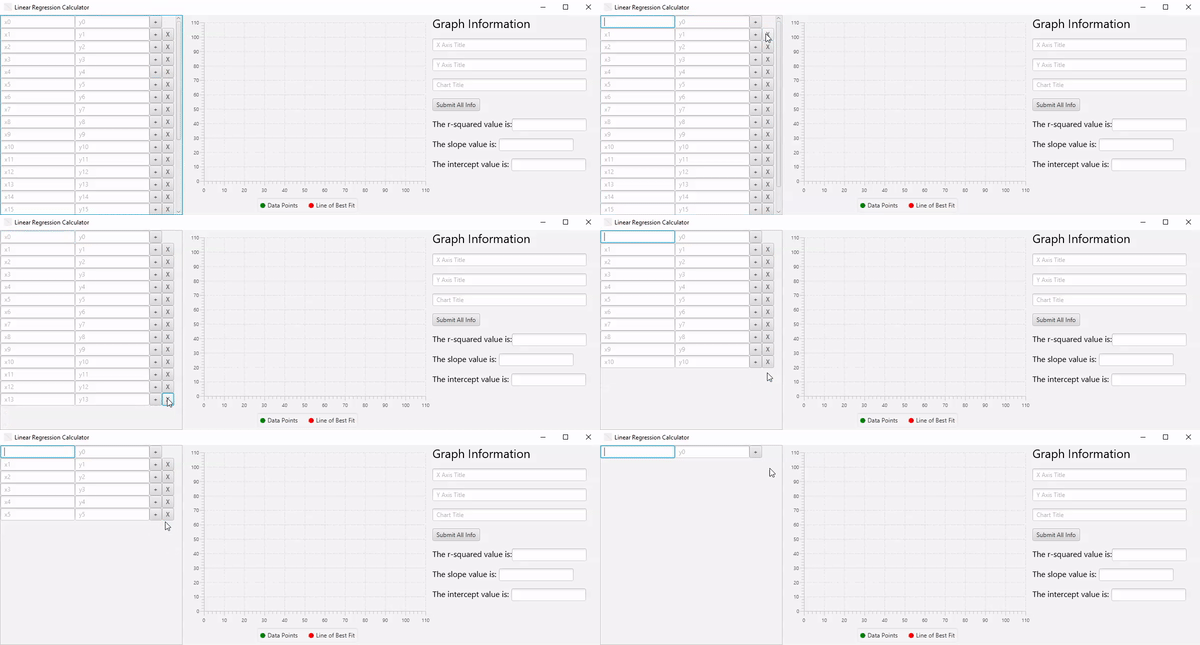
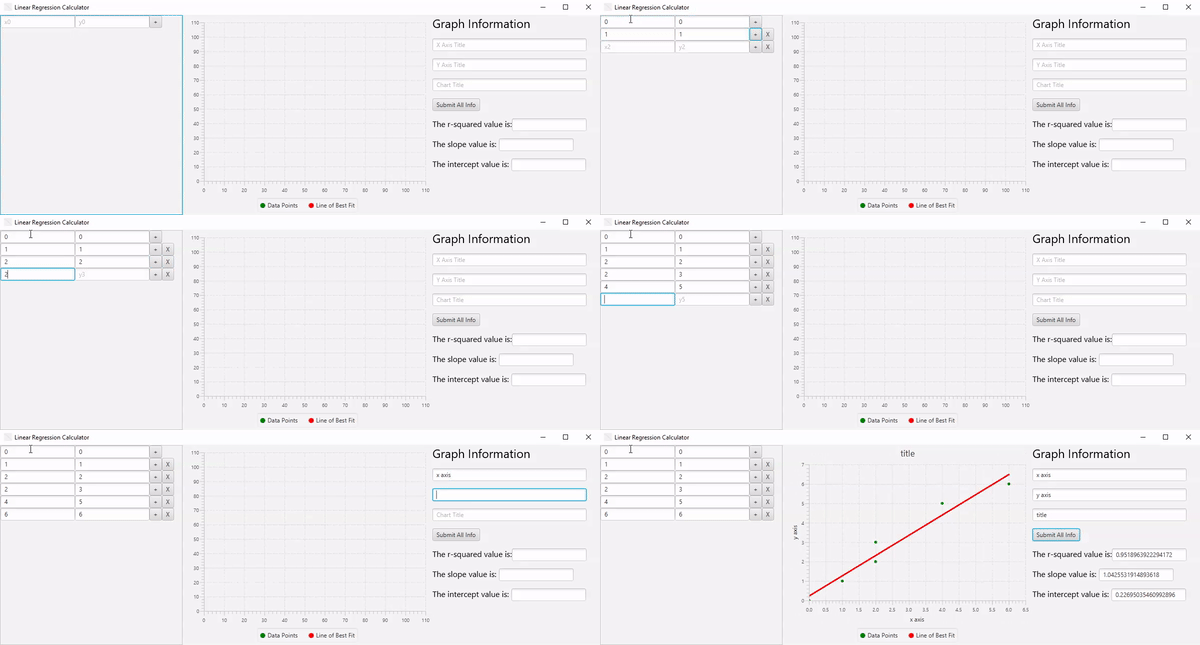
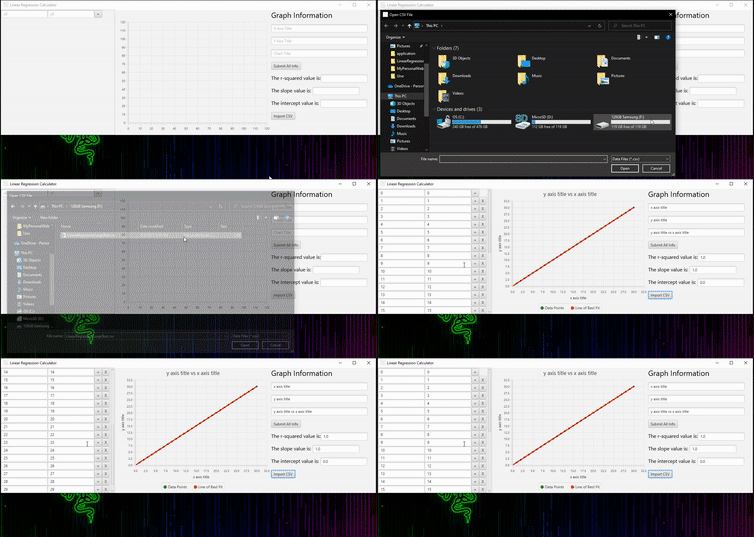
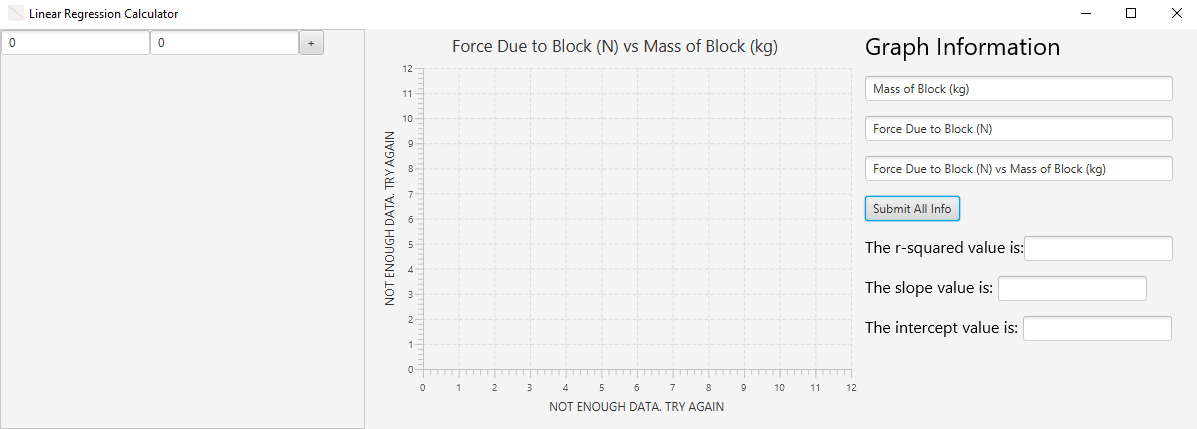
As a personal project, I created a linear regression calculator. Data is inputted in the data boxes on the left of the program. To add more data, just click on the + next to any of the data boxes. To remove a specific piece of data, just click the x button next to that data piece. Data labels such as x0,y0 and x1,y1 will change when data is removed to help count how many data points there are automatically. When there are many data points there will be a scroll bar that allows scrolling through all data points. The right side of the program shows 3 input boxes for the X axis label, Y axis label, and Graph Title. Clicking the submit button will tell the program to calculate the r-squared value and find the line of best fit. The graph will plot the data points and the line of best fit. The r-squared, slope, and intercept values will all be copyable by selecting them. There are 3 errors possible. The first error is not having enoguh data. If there isn't enough data then the graph will remove all data, and the labels will let the users know what the error is. The second error is incorrect data input. If a user types a non number or forgets to input data then the boxes that are incorrect will highlight red and change the graph labels to let the user know the errors. The last error is Incorrect Format error which happens whenever a csv is imported and the csv does not fit the correct import spec. Data can now be imported through csv files. The first row is the name of the x data and name of the y data. All rows after contain an x and y value.
To Use, just download the .exe file: https://github.com/MitchellGray100/LinearRegression/raw/main/EXE/LinearRegression.exe.
If you gen a JNI error, make sure to download java.
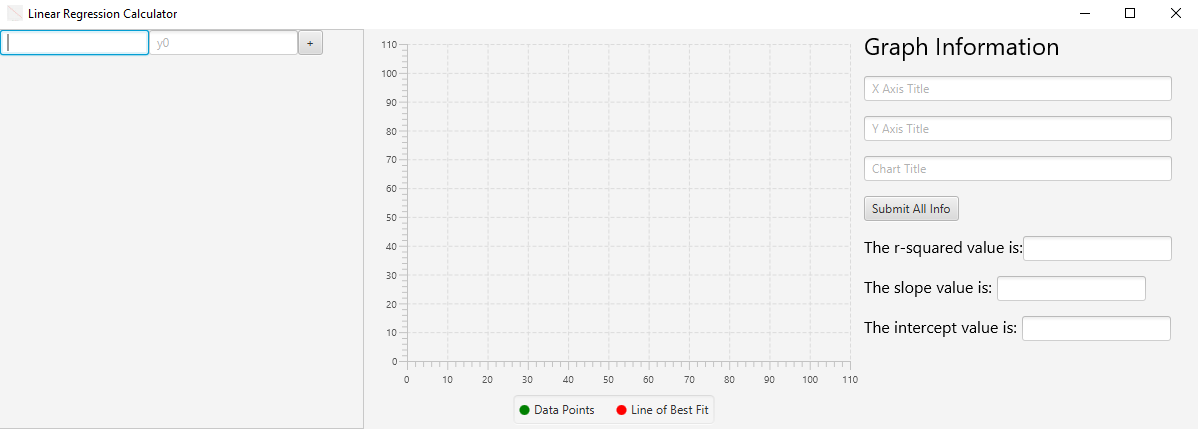
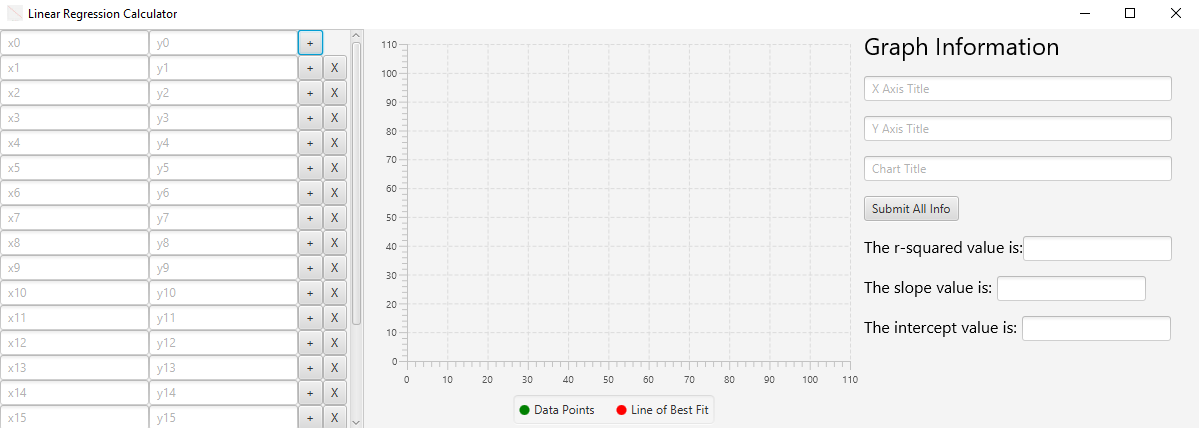
This is what the program looks like when it first opens.
Example usage of the program with an r-squared of 1.
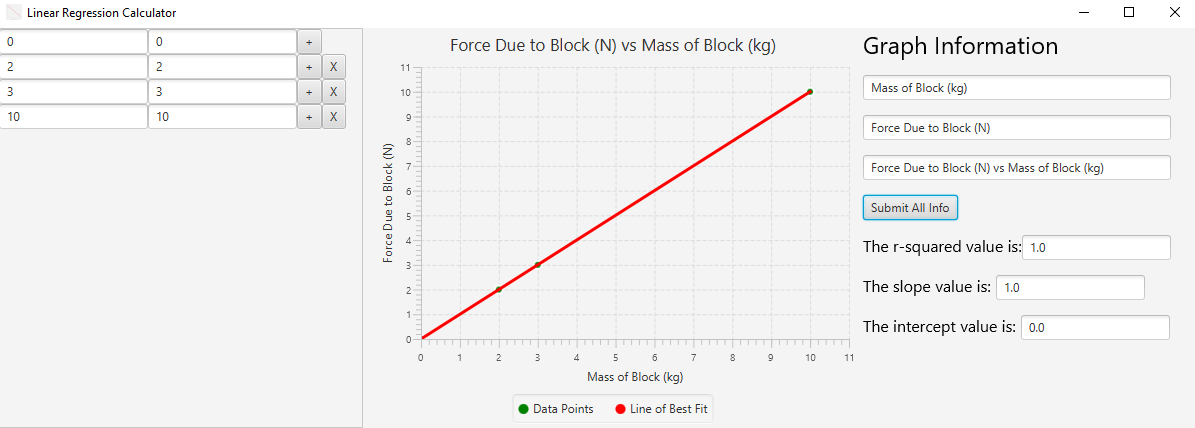
Example of Not Enough Data Error.
Lots of data points with the scroll bar and xn,yn labels for each point.
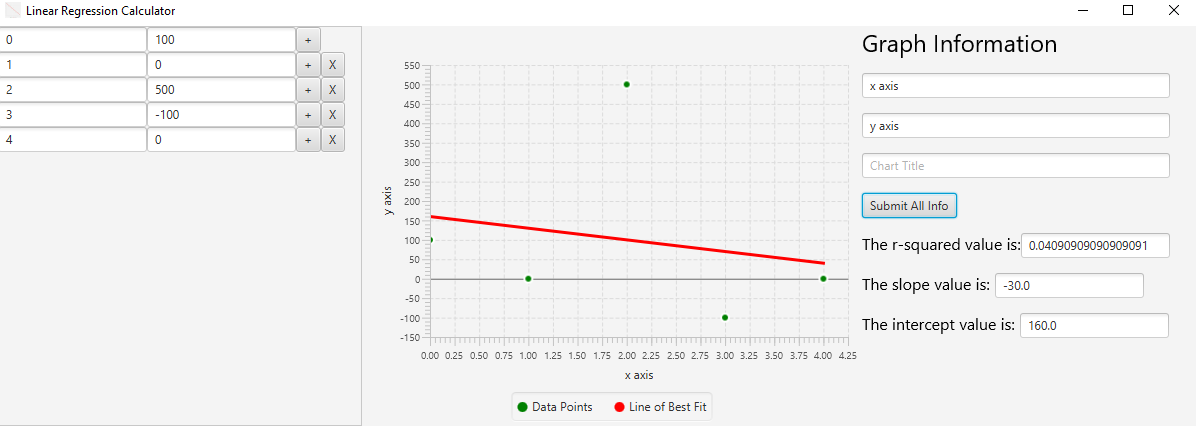
Example usage of the program with an r-squared of 0.041
Example of importing a .csv file.
