A monitoring solution for node runners and validators utilizing docker containers with Prometheus, Grafana, NodeExporter, and alerting with AlertManager.
This is intended to be a single-stop solution for monitoring your Slinky Side Car needs.
Clone this repository on your Docker host, cd into slinky-monitoring directory and run compose up:
git clone https://github.com/LavenderFive/slinky-monitoring
cd slinky-monitoring
cp .env.sample .env
export NODE_URL=http://localhost:1317 # Enter your own node url here
docker run -it --rm --entrypoint sh -v $(pwd)/slinky:/slinky ghcr.io/skip-mev/slinky-sidecar:v0.4.1 -c "slinky-config --chain dydx \
--node-http-url $NODE_URL --raydium-enabled --solana-node-endpoint \
https://solana.polkachu.com,https://slinky-solana.kingnodes.com,https://solana.lavenderfive.com,https://solana-rpc.rhino-apis.com,https://dydx.helius-rpc.com \
--oracle-config-path /slinky/oracle.json"
sed -i '' "s/<YOUR_IP>/${NODE_URL}/g" prometheus/prometheus.yml
docker-compose up -dgit clone https://github.com/LavenderFive/slinky-monitoring
cd slinky-monitoringThe .env file has very basic settings for logins, etc.
cp .env.sample .envThis command will create the Slinky oracle.json config file under ~/slinky-monitoring/slinky. Unless you are running this repo
on the same server as the node, you will want to change the NODE_URL from localhost.
cd ~/slinky-monitoring
export NODE_URL=localhost:1317 # Enter your own node url here
docker run -it --rm --entrypoint sh -v $(pwd)/slinky:/slinky ghcr.io/skip-mev/slinky-sidecar:v0.4.1 -c "slinky-config --chain dydx \
--node-http-url $NODE_URL --raydium-enabled --solana-node-endpoint \
https://solana.polkachu.com,https://slinky-solana.kingnodes.com,https://solana.lavenderfive.com,https://solana-rpc.rhino-apis.com,https://dydx.helius-rpc.com \
--oracle-config-path /slinky/oracle.json"The following will set your IP address in prometheus.yml. If you are using non-standard daemon prometheus metrics port, 26660, you will need to modify prometheus/prometheus.yml.
cd ~/slinky-monitoring
sed -i '' "s/<YOUR_IP>/${NODE_URL}/g" prometheus/prometheus.ymlSlinky supports the addition of state-RPCs to gather data directly from Solana and EVM chains. The Skip and dYdX team have already set up relationships and pre-paid for API endpoints you can use to get this data.
For each RPC URL, you will need an API key unique to your validator. To get this, go to the dYdX validator slack channel (which you should already be invited to once you make it into the active set), and request API keys from Helius, Polkachu, KingNodes, LavenderFive, and RhinoStake. Each of these are necessary to load into your config so your decentralized providers can work properly.
Once you have your 5 API keys, head to slinky-monitoring/slinky/oracle.json and configure endpoint(s) for each provider.
Then you must fill in your API keys. You should use the URLs listed below, and ask on the Slack #ext-dydx-validators-discussion or #v-dydx-private-testnet-discussion channels: for API keys to fill in below.
More information can be found here.
{
   "name": "raydium_api",
   "api": {
      "endpoints": [
        {
          "url": "https://solana.polkachu.com"
          "authentication": {
              "apiKey": "X-Api-Key",
              "apiKeyHeader": "API KEY YOU'VE RETRIEVED FROM SLACK"
          }
        },
        {
          "url": "https://slinky-solana.kingnodes.com"
          "authentication": {
              "apiKey": "X-Api-Key",
              "apiKeyHeader": "API KEY YOU'VE RETRIEVED FROM SLACK"
          }
        },
        {
          "url": "https://solana.lavenderfive.com"
          "authentication": {
              "apiKey": "X-Api-Key",
              "apiKeyHeader": "API KEY YOU'VE RETRIEVED FROM SLACK"
          }
        },
        {
          "url": "https://solana-rpc.rhino-apis.com"
          "authentication": {
              "apiKey": "X-Api-Key",
              "apiKeyHeader": "API KEY YOU'VE RETRIEVED FROM SLACK"
          }
        },
        {
          "url": "https://dydx.helius-rpc.com"
          "authentication": {
              "apiKey": "X-Api-Key",
              "apiKeyHeader": "API KEY YOU'VE RETRIEVED FROM SLACK"
          }
        }
      ]
   }
}This monitoring solution comes built in with a Slinky Monitoring dashboard, which works out of the box. Grafana, Prometheus, and Infinity are installed automatically.
Navigate to http://<host-ip>:3000 and login with user admin password admin. You can change the credentials in the compose file or by supplying the ADMIN_USER and ADMIN_PASSWORD environment variables on compose up. The config file can be added directly in grafana part like this
grafana:
  image: grafana/grafana:7.2.0
  env_file:
    - .env
and the config file format should have this content
GF_SECURITY_ADMIN_USER=admin
GF_SECURITY_ADMIN_PASSWORD=changeme
GF_USERS_ALLOW_SIGN_UP=false
If you want to change the password, you have to remove this entry, otherwise the change will not take effect
- grafana_data:/var/lib/grafanaGrafana is preconfigured with dashboards and Prometheus as the default data source:
- Name: Prometheus
- Type: Prometheus
- Url: http://prometheus:9090
- Access: proxy
Monitor Services Dashboard
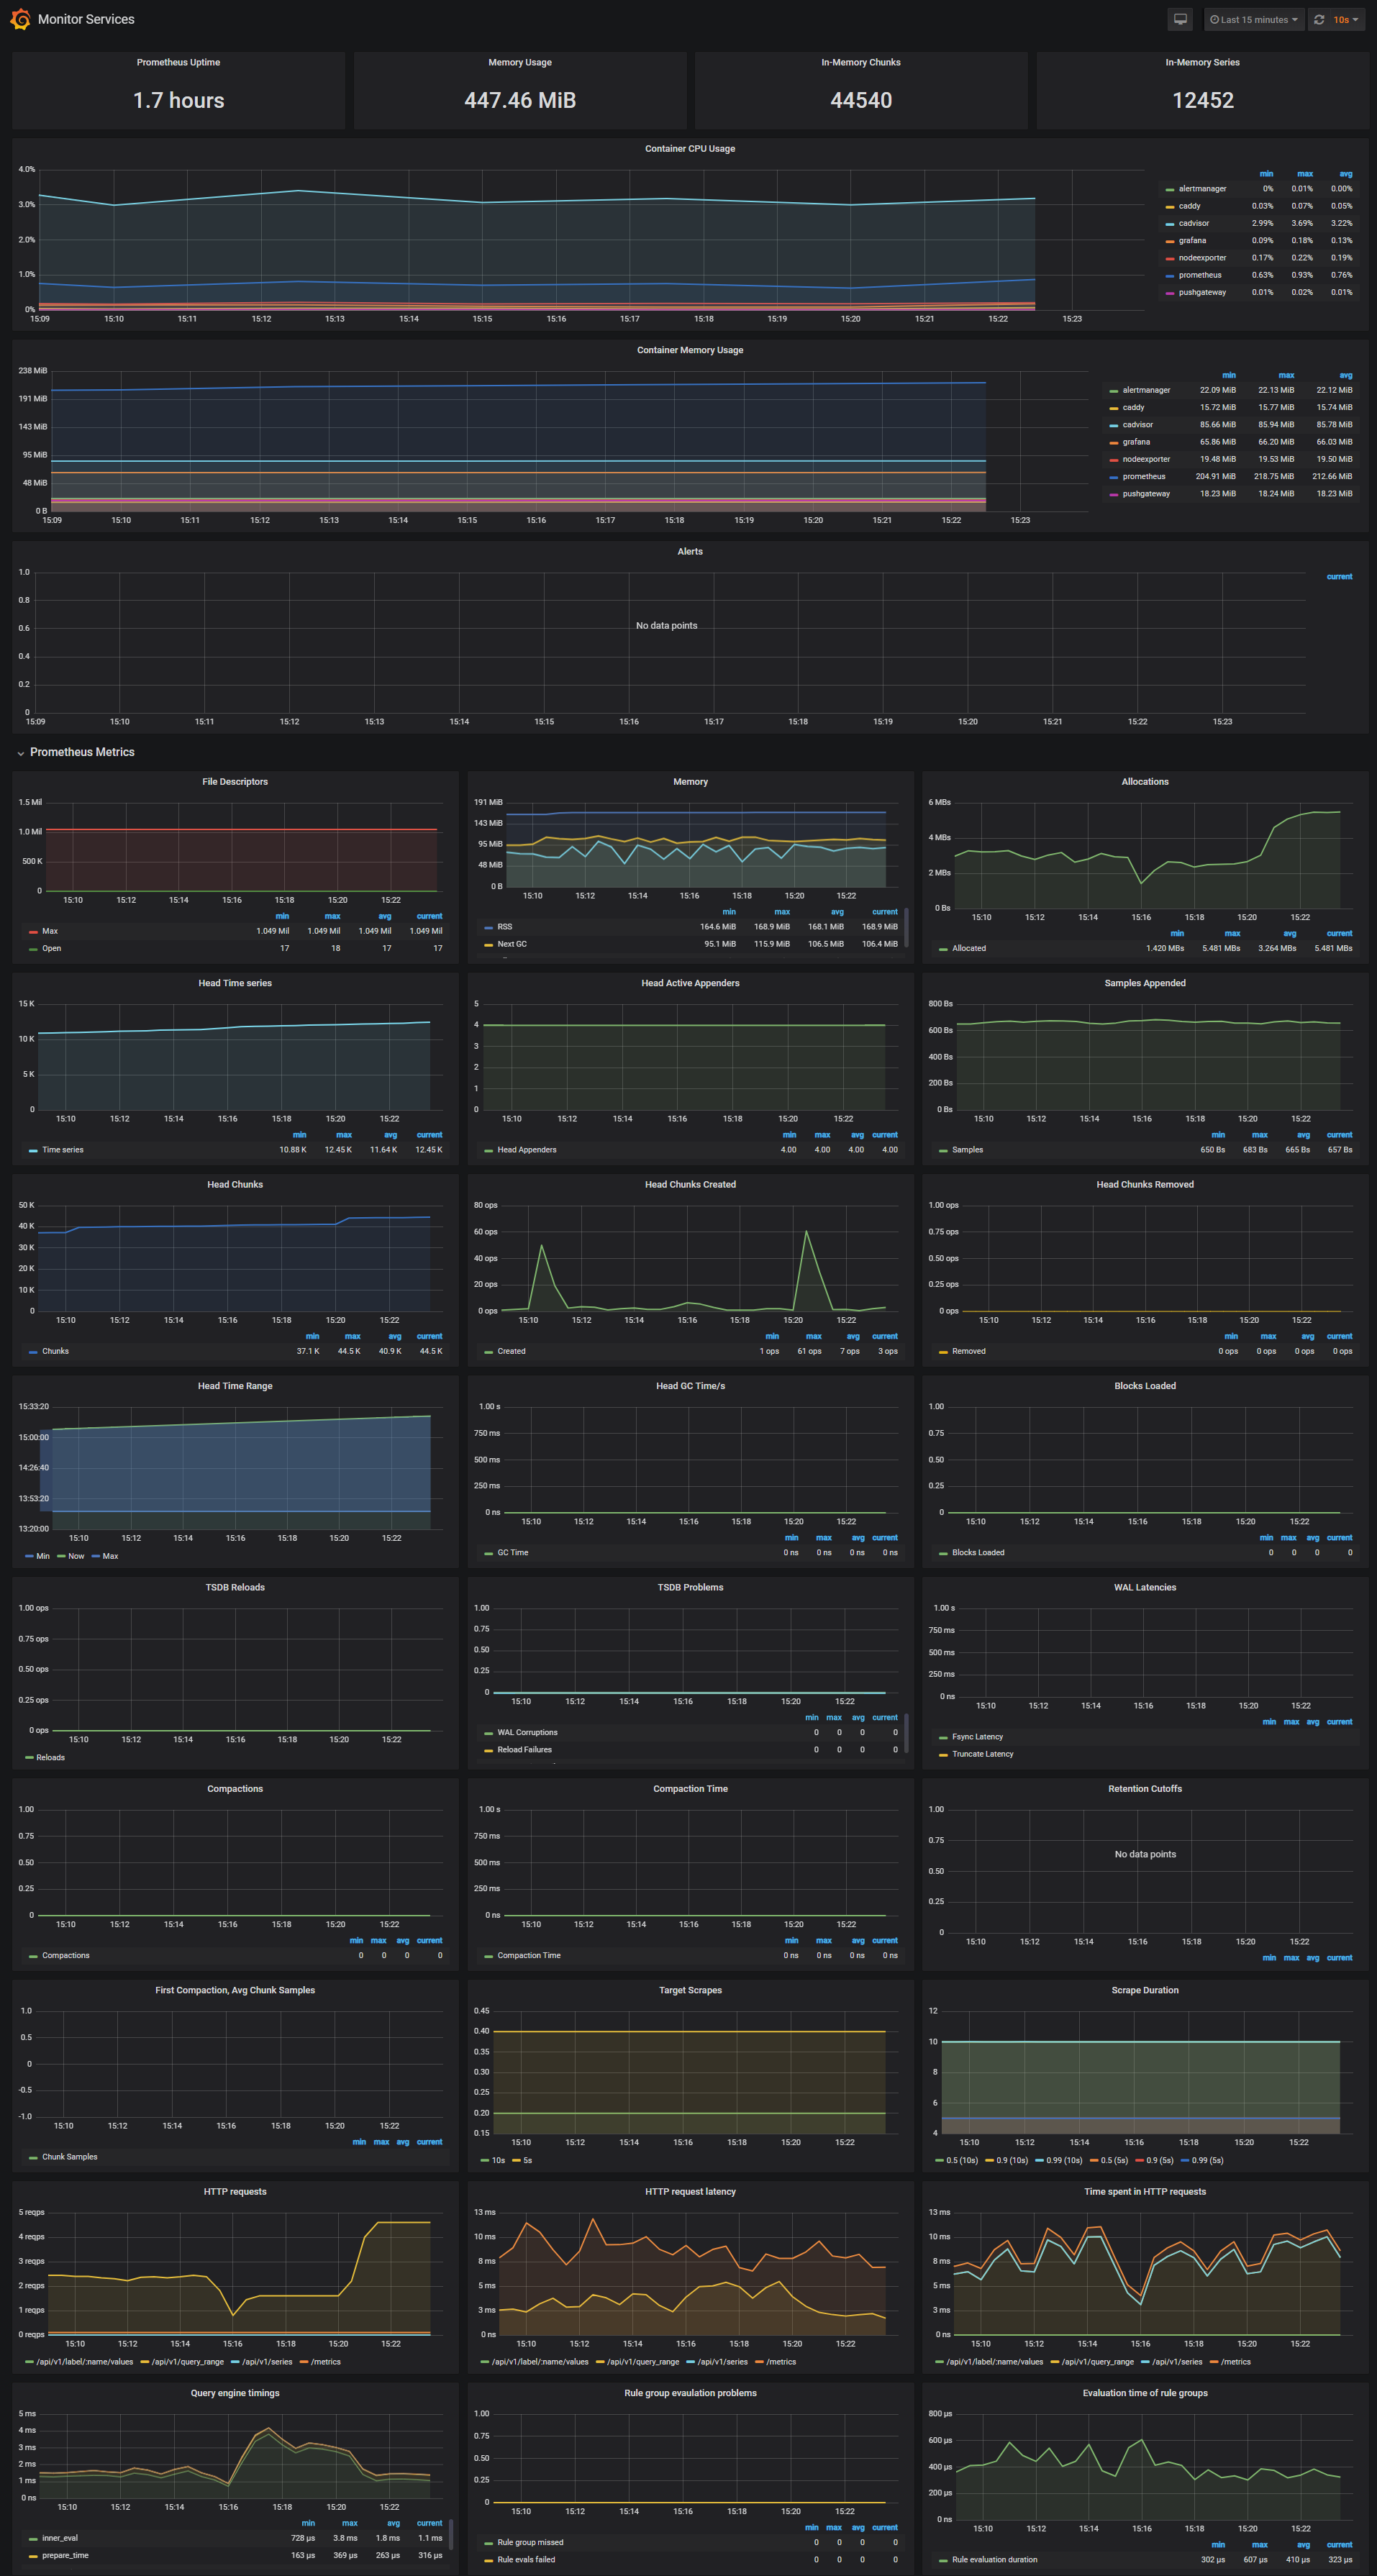
The Monitor Services Dashboard shows key metrics for monitoring the containers that make up the monitoring stack:
- Prometheus container uptime, monitoring stack total memory usage, Prometheus local storage memory chunks and series
- Container CPU usage graph
- Container memory usage graph
- Prometheus chunks to persist and persistence urgency graphs
- Prometheus chunks ops and checkpoint duration graphs
- Prometheus samples ingested rate, target scrapes and scrape duration graphs
- Prometheus HTTP requests graph
- Prometheus alerts graph
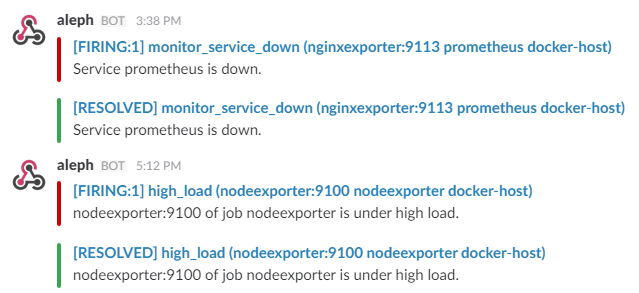
Two alert groups have been setup within the alert.rules configuration file:
You can modify the alert rules and reload them by making a HTTP POST call to Prometheus:
curl -X POST http://admin:admin@<host-ip>:9090/-/reloadMonitoring services alerts
Trigger an alert if any of the monitoring targets (node-exporter and cAdvisor) are down for more than 30 seconds:
- alert: monitor_service_down
    expr: up == 0
    for: 30s
    labels:
      severity: critical
    annotations:
      summary: "Monitor service non-operational"
description: "Service {{ $labels.instance }} is down."The AlertManager service is responsible for handling alerts sent by Prometheus server. AlertManager can send notifications via email, Pushover, Slack, HipChat or any other system that exposes a webhook interface. A complete list of integrations can be found here.
You can view and silence notifications by accessing http://<host-ip>:9093.
The notification receivers can be configured in alertmanager/config.yml file.
To receive alerts via Slack you need to make a custom integration by choose incoming web hooks in your Slack team app page. You can find more details on setting up Slack integration here.
Copy the Slack Webhook URL into the api_url field and specify a Slack channel.
route:
    receiver: 'slack'

receivers:
    - name: 'slack'
      slack_configs:
          - send_resolved: true
            text: "{{ .CommonAnnotations.description }}"
            username: 'Prometheus'
            channel: '#<channel>'
            api_url: 'https://hooks.slack.com/services/<webhook-id>'