Memprof is HPC Cluster Program Profiler. It records the memory, processor, and IO usage of a process. It will then generate a graph of the results.
- Created By Volodymyr Kindratenko (kindrtnk@illinois.edu) at NCSA (http://www.ncsa.illinois.edu/)
- Imagemagick - https://imagemagick.org/
- GNUPlot - http://www.gnuplot.info/
- Download a release or git clone the repository
git clone https://github.com/IGBIllinois/memprof.git
- Add /bin folder to your PATH
export PATH=INSTALLATION_DIR/bin:$PATH
- Run memprof.sh then the program and parameters as you normally would
memprof.sh PROGRAM_NAME PARAMETERS
- This generates a csv file in the memprof directory of your current working directory in the format memprof-JOB_NUMER-PROCESS_ID.csv The JOB_NUMBER will be either the SLURM or PBS Torque Job Number. The PROCESS_ID is the local node process number. If you want it to go to a different directory set the $MEMPROF_DIR environment variable.
export $MEMPROF_DIR="/home/username/memprof"
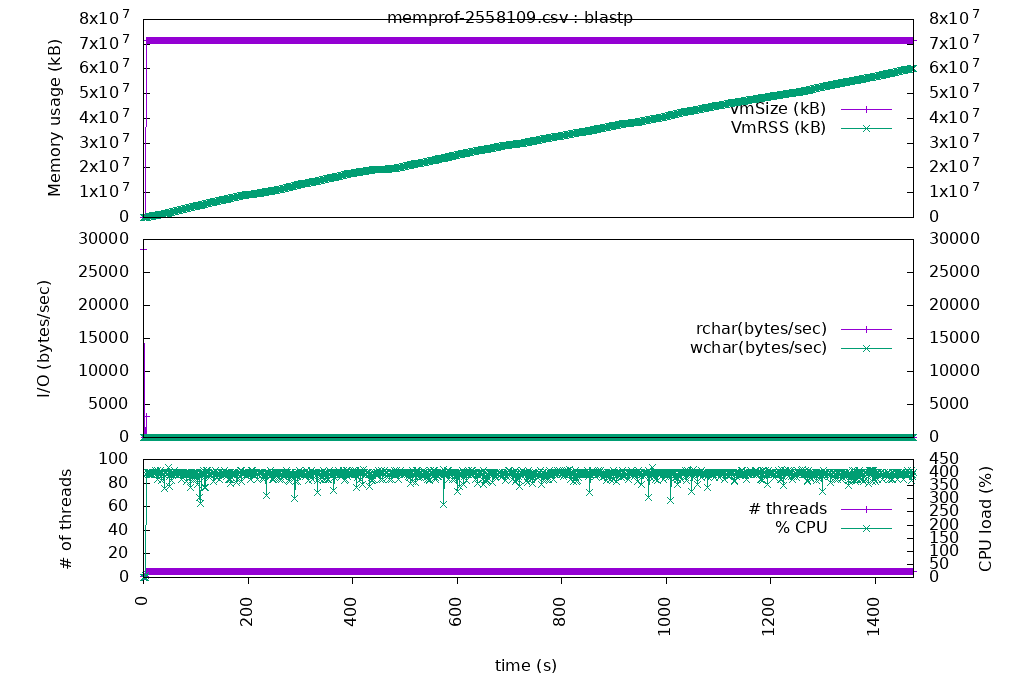
- To generate graph run plotone.sh CSV_FILE. Replace CSV_FILE with the memprof CSV file that was generated in the memprof folder. This will generate a PNG file with the memory, IO, and processor usage in one graph
plotone.sh memprof-1773740-2558109.csv