-
Notifications
You must be signed in to change notification settings - Fork 556
Visual Studio X86 Assembly Debugger
Original article written by Kudzu
Several users have written to me requesting information on the new Cosmos X86 assembly level debugger. Because of the great interest, I have written this short preview article.
Cosmos already has an integrated Visual Studio debugger for debugging C# and VB.NET code. However, to debug, X86 assembly users need to resort to GDB. Cosmos also includes a partial GDB front end, but the linkage between the IL and C# code was lost and requires a lot of mental parsing.
Eventually, we hope to expand our new assembly debugger so that GDB will only rarely be needed and only for very deep debugging such as the debug stub. The X86 debugger allows you to set a breakpoint in C#, and then see the IL as well as X86 ASM, as well as registers.
Cosmos is an Operating System development kit which uses Visual Studio as its development environment. Despite C# in the name, any .NET based language can be used, including VB.NET, Fortran, Delphi Prism, IronPython, F#, and more. Cosmos itself and the kernel routines are primarily written in C#, and thus the Cosmos name. Besides that, NOSMOS (.NET Open Source Managed Operating System) sounds stupid.
Cosmos is not an Operating System in the traditional sense, but instead it is an "Operating System Kit", or as I like to say, "Operating System Legos". Cosmos lets you create Operating Systems just as Visual Studio and C# normally let you create applications. Most users can write and boot their own Operating System in just a few minutes, all using Visual Studio. Cosmos supports integrated project types in Visual Studio, and an integrated debugger, breakpoints, watches, and more. You can debug your Operating System the same way that you debug a normal C# or VB.NET application.
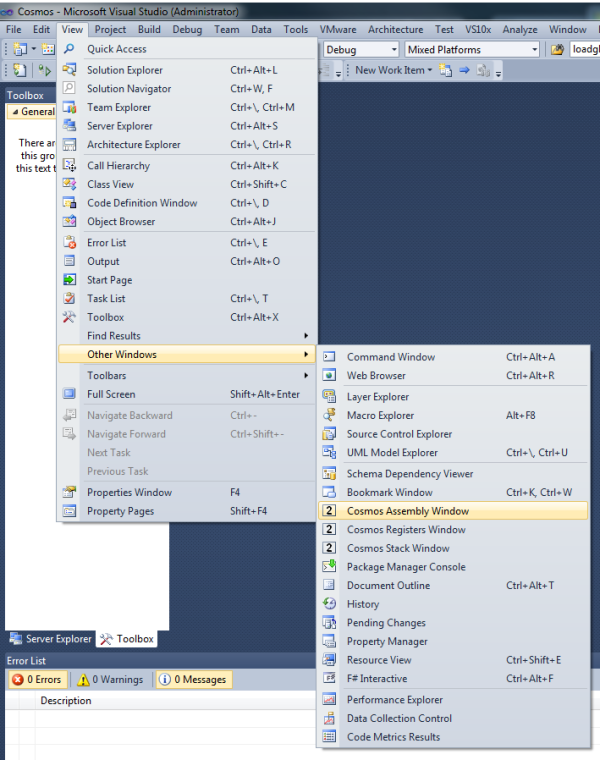
First open the new Cosmos tool windows.
Currently, only the assembly and registers window are functional. The stack / frame window will be functional in the next few days. We will also be adding additional windows allowing direct memory inspection, and eventually assembly level stepping.
Now set a breakpoint in the C# code and run your Operating System. If you have the defaults, VMWare will appear with your Operating System, and Visual Studio will stop on the breakpoint.
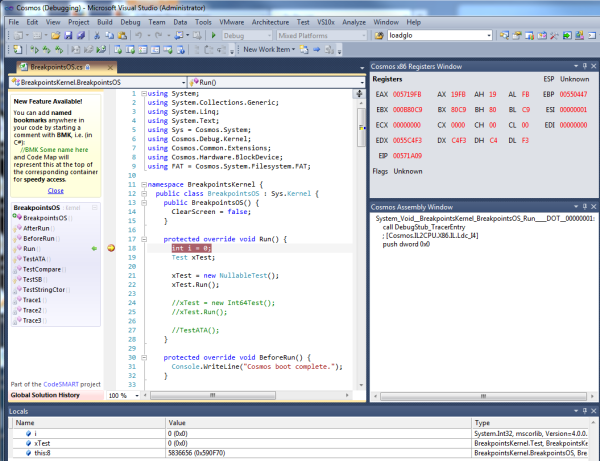
You will notice that the local watch window is functional. This is part of the Cosmos Visual Studio debugger. What is new though are the two assembly debugger windows shown on the right. The assembly window shows the IL and X86 assembly for the line with the breakpoint. If more breakpoints are set, or stepping is used and the assembly debugger windows will update each time. Note that there is a small bug and it shows in this screenshot. It only shows one IL op in the assembly window. It should read:
System_Void__BreakpointsKernel_BreakpointsOS_Run____DOT__00000001:
        call DebugStub_TracerEntry
        ; [Cosmos.IL2CPU.X86.IL.Ldc_I4]
        push dword 0x0
        ; Stack contains 1 items: (4)

System_Void__BreakpointsKernel_BreakpointsOS_Run____DOT__00000002:
        ; [Cosmos.IL2CPU.X86.IL.Stloc]
        ; EBPOffset = 4
        pop dword EAX
        mov dword [EBP + -4], EAX
        ; Stack contains 0 items: ()
The registers window shows the X86 registers at the beginning of the assembly window. Values are shown in red if they have changed since the last display. This is very useful in monitoring changes.
If Cosmos is written in C#, why do we need such a low level debugger? Most users we hope will only need to use the C# debugger. However, for users who are working on the compiler (IL2CPU) or for debugging direct hardware interactions, the assembly level debugger is a huge help.

