Home
Samplot is a command line tool for rapid, multi-sample structural variant
visualization. samplot takes SV coordinates and bam files and produces
high-quality images that highlight any alignment and depth signals that
substantiate the SV.
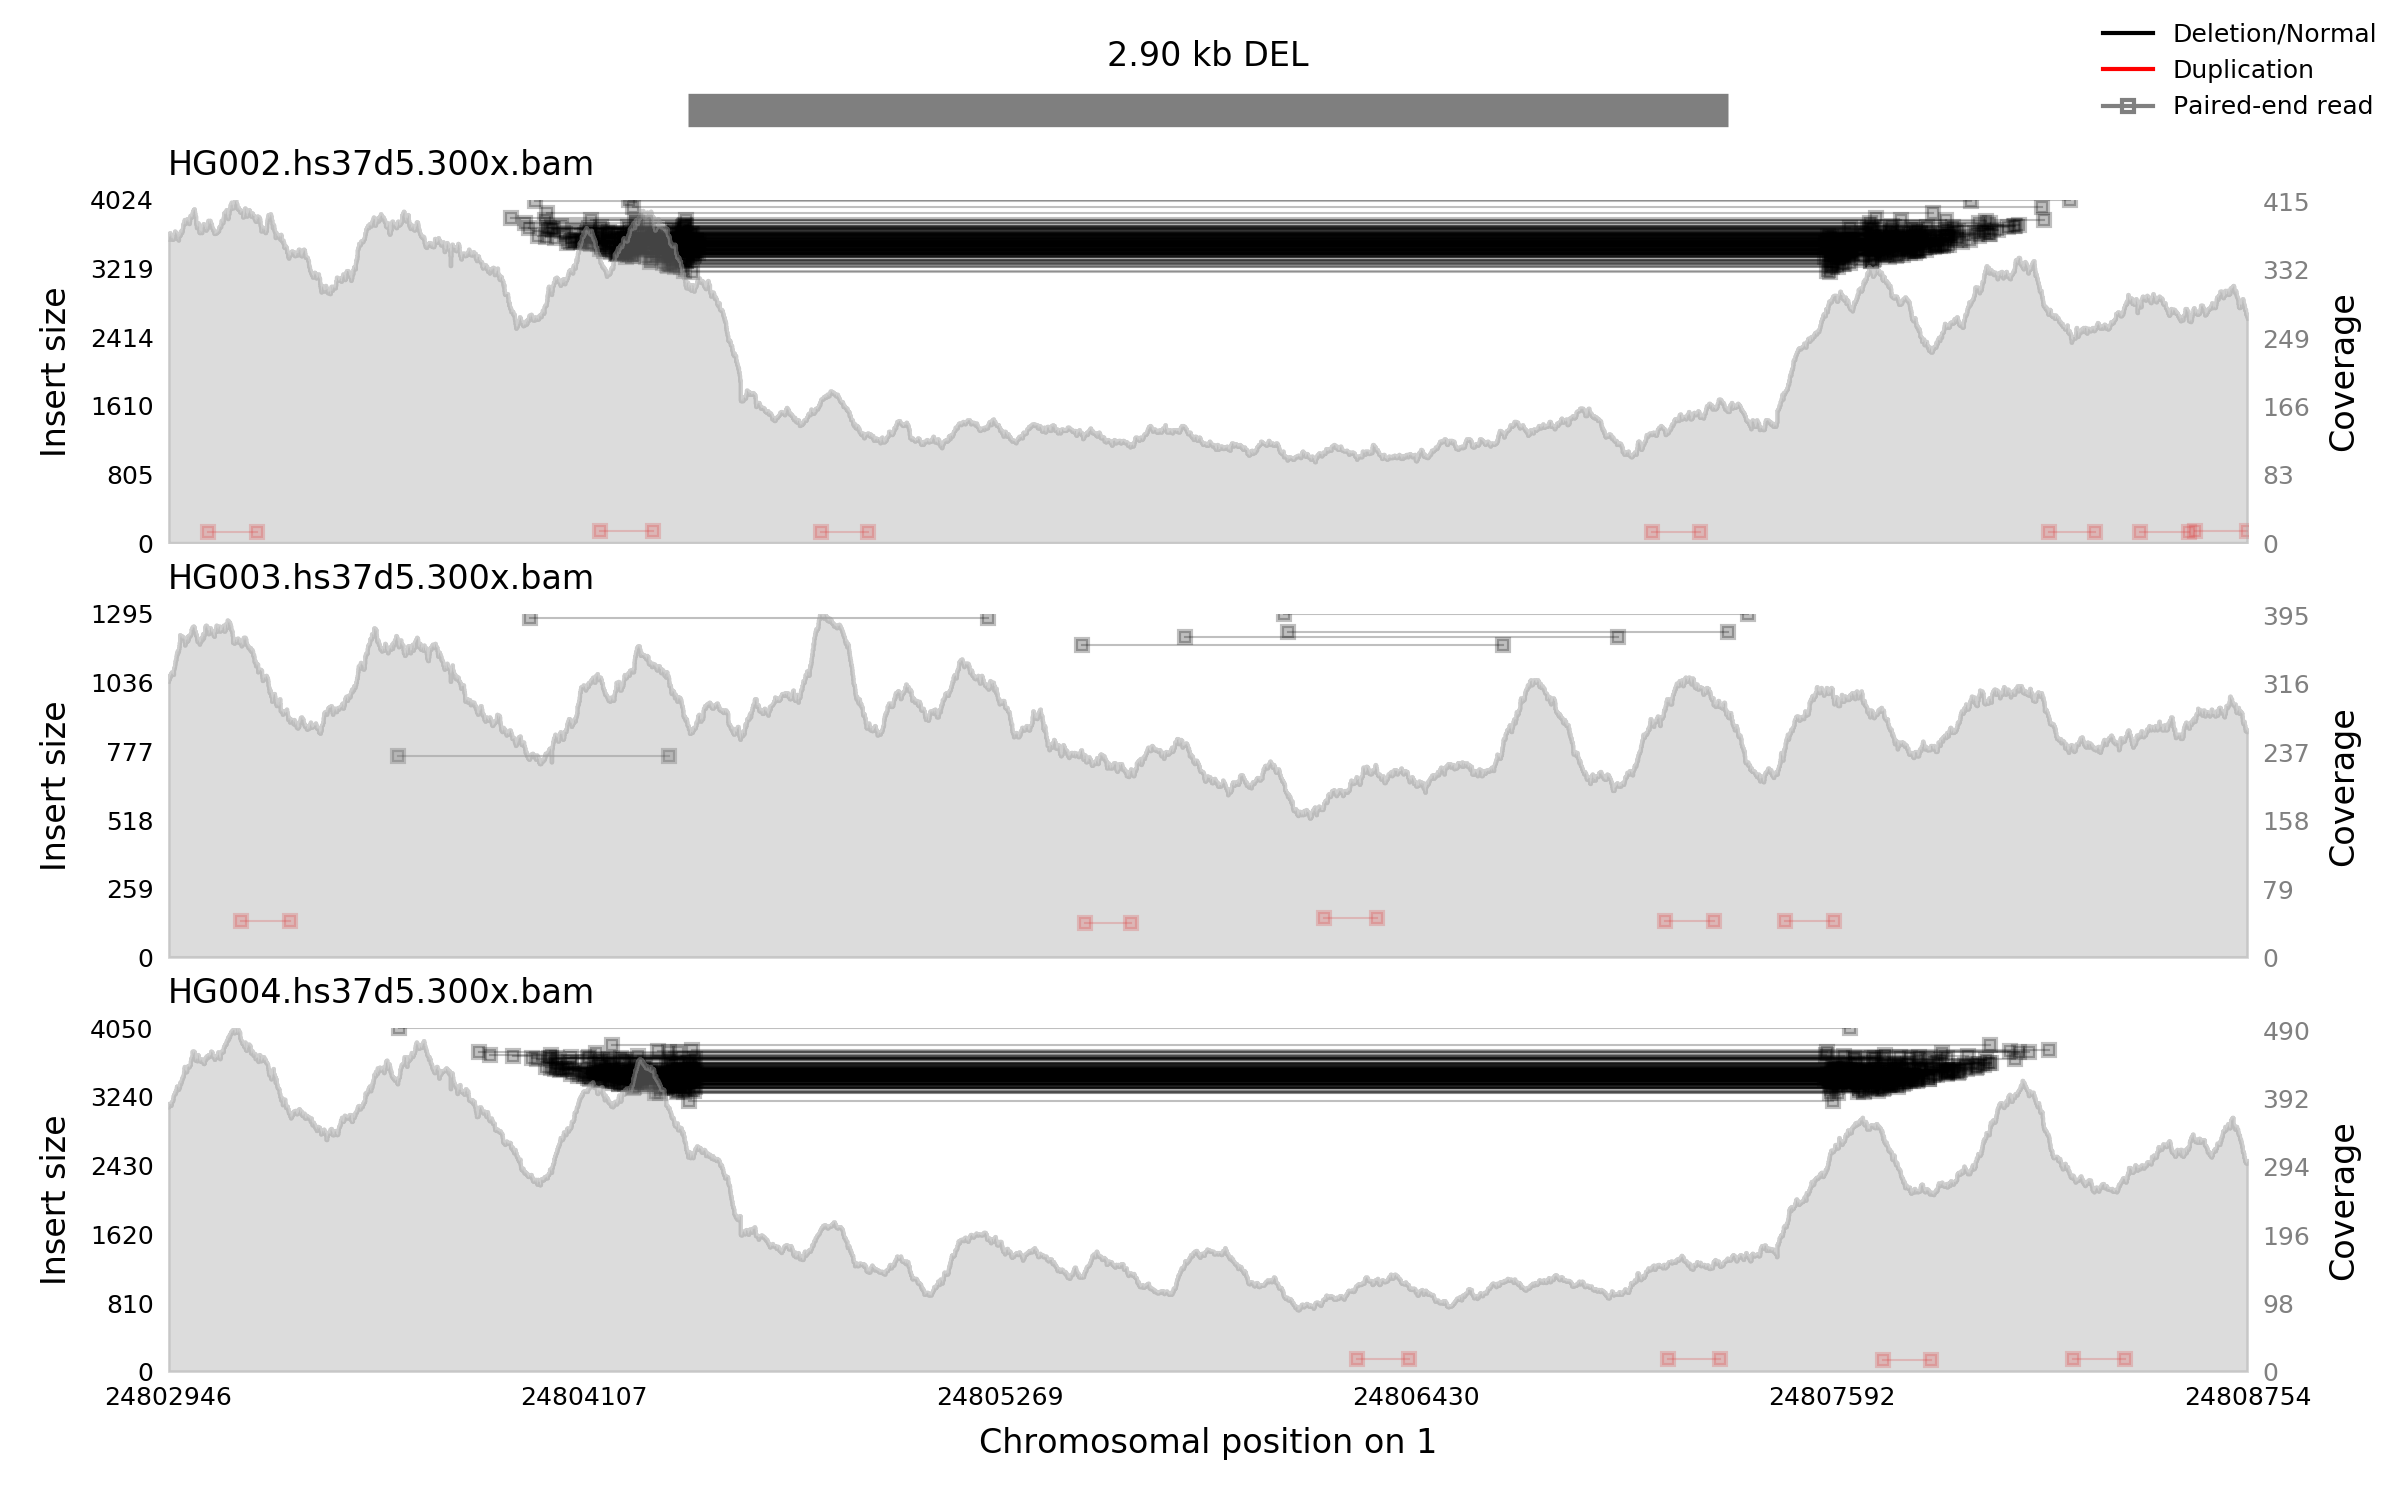
The following command creates a plot of alignment data from three samples where a deletion has occurred in the region 1:24804398-24807302. The resulting plot is saved to a file called 1_24804398_24807302_DEL_trio.png.
samplot plot \
-c 1 \
-s 24804398 \
-e 24807302 \
-t DEL \
-b HG002.hs37d5.300x.bam \
   HG003.hs37d5.300x.bam \
   HG004.hs37d5.300x.bam \
-d 1 \
-o 1_24804398_24807302_DEL_trio.png
Samplot is available from bioconda and is installable via the conda package manager:
conda install -c bioconda samplot
Samplot plot has a number of available command-line parameters to improve the utility of the plots created. For basic information, including more in-depth discussion of the example above, go to the Basic Options page. For more complex options, go to the Advanced Options page.
Samplot plot supports sequence data from Illumina, Oxford Nanopore Technology, Pacific Biosciences, and 10X Genomics. For more information, see Plotting ONT, PacBio, and 10X Data page.
Samplot vcf is a powerful tool for analysis of structural variants from a VCF file. For more information, see Plotting variants from a VCF page.