rust-analyzer consumes huge amounts of RAM and gets stuck #16050
Comments
|
So @NickAcPT was telling about this issue and I did not believe him at first. So I tested it on my PC. PC SpecsI watched the memory usage climb to 36000mb before I killed Rust Analyzer. |
|
What happens if you run |
|
I attempted to get some log information by setting |
|
I can reproduce even without build scripts and proc macros. CC @Veykril this is on nightly. |
Ran it, but it behaved properly. |
|
@lnicola Would it be helpful with diagnosing the issue for me to setup a dev env for r-a and attempt to |
|
Will take a look at that in a bit, very good that this only happens on hover (or possibly other IDE features), we most likely loop indefinitely (while pushing multiple items on the work stack) when trying to downmap tokens in the IDE layer. |
|
Yep my hunch was right (fwiw I don't even have to do anything, semantic highlighting already triggers this for me) |
|
We are actually just doing an accidental quadratic amount of work. For each token in a macro call we are downmapping we add all relevant tokens in the expansion to the queue. That used to work fine before because relevant was exactly the downmapped tokens for the input token. Things changed now though, we are looking for tokens with a no longer changing span making this quadratic (and So, its easy to fix (confirmed already locally), will spend a bit more time on cleaning that part up now though. |
While trying to work on a specific file on my project, r-a starts using all memory available.
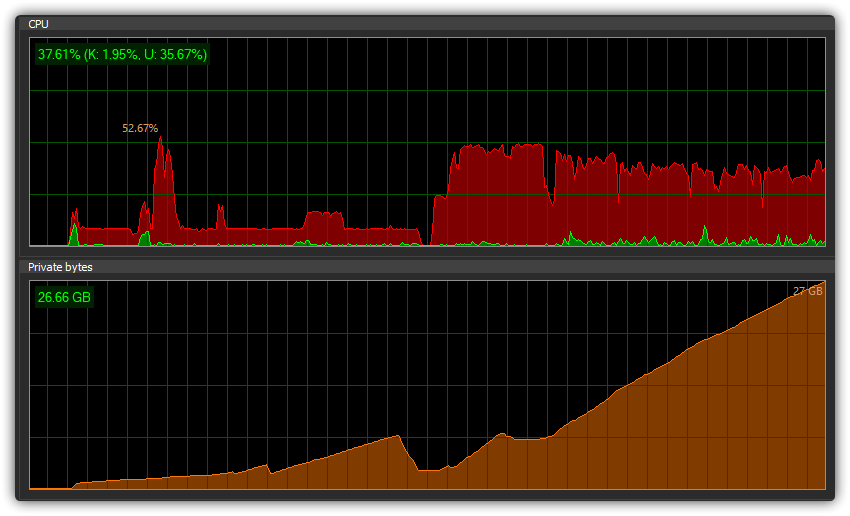
I attempted to get a Memory Usage from r-a while it was consuming memory, but I don't know how accurate it is:
Memory Usage
Per-query memory usage:
117mb 10108 FileTextQuery
11mb 320 CrateDefMapQueryQuery
10mb 223921 LangAttrQuery
10mb 131525 InternFunctionQuery
10mb 131620 InternConstQuery
10mb 75623 InternMacroCallQuery
8mb 147795 InternSyntaxContextQuery
4mb 109534 InternImplQuery
3856kb 78483 ImplSelfTyQuery
3812kb 69351 AstIdMapQuery
3752kb 78483 ImplTraitQuery
3480kb 64745 ParseMacroExpansionQuery
1288kb 77 ImportMapQuery
1232kb 39884 MacroArgQuery
1116kb 947 DeclMacroExpanderQuery
1060kb 26941 InternTypeAliasQuery
0b 1 ProcMacrosQuery
0b 10108 FileSourceRootQuery
0b 366 SourceRootQuery
0b 1 SourceRootCratesQuery
0b 35 StructDataQuery
0b 35 StructDataWithDiagnosticsQuery
0b 0 UnionDataQuery
0b 0 UnionDataWithDiagnosticsQuery
0b 1023 TraitDataQuery
0b 0 TraitAliasDataQuery
0b 338 TypeAliasDataQuery
0b 32 ConstDataQuery
0b 0 StaticDataQuery
0b 0 Macro2DataQuery
0b 0 MacroRulesDataQuery
0b 0 ProcMacroDataQuery
0b 41 ExprScopesQuery
0b 2 FieldsAttrsQuery
0b 0 VariantsAttrsSourceMapQuery
0b 2 FieldsAttrsSourceMapQuery
0b 187 LangItemQuery
0b 40 FieldVisibilitiesQuery
0b 44 FunctionVisibilityQuery
0b 3 ConstVisibilityQuery
0b 0 CrateSupportsNoStdQuery
0b 0 ExternCrateDeclDataQuery
0b 0 InternAnonymousConstQuery
0b 208 InternExternCrateQuery
0b 21881 InternUseQuery
0b 44 MirBodyQuery
0b 13127 TyQuery
0b 80 ValueTyQuery
0b 700 ConstParamTyQuery
0b 8 ConstEvalQuery
0b 9 ConstEvalDiscriminantQuery
0b 45 FieldTypesQuery
0b 5 LayoutOfAdtQuery
0b 16 TargetDataLayoutQuery
0b 85 CallableItemSignatureQuery
0b 29 ReturnTypeImplTraitsQuery
0b 219 GenericPredicatesForParamQuery
0b 50 TraitEnvironmentQuery
0b 11 InherentImplsInBlockQuery
0b 70 InternCallableDefQuery
0b 0 InternLifetimeParamIdQuery
0b 0 InternImplTraitIdQuery
0b 15 InternTypeOrConstParamIdQuery
0b 0 InternClosureQuery
0b 0 InternGeneratorQuery
0b 38 AssociatedTyDataQuery
0b 43 StructDatumQuery
0b 0 FnDefDatumQuery
0b 0 FnDefVarianceQuery
0b 42 AdtVarianceQuery
0b 190 AssociatedTyValueQuery
0b 0 ModuleSymbolsQuery
0b 0 LibrarySymbolsQuery
0b 1 LocalRootsQuery
0b 1 LibraryRootsQuery
0b 1 LineIndexQuery
0b 18367 InternStructQuery
0b 512 InternUnionQuery
0b 2061 InternEnumQuery
0b 309 InternStaticQuery
0b 1739 InternTraitQuery
0b 1 InternTraitAliasQuery
0b 8420 InternExternBlockQuery
0b 419 InternBlockQuery
0b 42 InternMacro2Query
0b 102 InternProcMacroQuery
0b 1665 InternMacroRulesQuery
-4096b 4849 RealSpanMapQuery
-4096b 1032 EnumDataQuery
-4096b 419 BlockItemTreeQueryQuery
-4096b 18 TraitImplsInBlockQuery
-8kb 419 BlockDefMapQuery
-8kb 103 InternInTypeConstQuery
-8kb 6 IncoherentInherentImplCratesQuery
-8kb 33 ProgramClausesForChalkEnvQuery
-12kb 1032 EnumDataWithDiagnosticsQuery
-12kb 44 InferQueryQuery
-12kb 61 TraitDatumQuery
-16kb 7779 ImplDatumQuery
-56kb 28 BorrowckQuery
-60kb 158 InherentImplsInCrateQuery
-72kb 78484 ImplDataQuery
-132kb 1099 TraitSolveQueryQuery
-140kb 1 CrateGraphQuery
-144kb 487 BodyQuery
-144kb 933 VariantsAttrsQuery
-144kb 160 TraitImplsInCrateQuery
-152kb 108 CrateLangItemsQuery
-256kb 7935 GenericPredicatesQuery
-272kb 459 ExpandProcMacroQuery
-276kb 4 TraitImplsInDepsQuery
-280kb 868 FunctionDataQuery
-364kb 13925 GenericDefaultsQuery
-560kb 1023 TraitDataWithDiagnosticsQuery
-976kb 78484 ImplDataWithDiagnosticsQuery
-992kb 487 BodyWithSourceMapQuery
-1840kb 92752 GenericParamsQuery
-4mb 4849 ParseQuery
-44mb 68955 FileItemTreeQuery
-52mb 234390 AttrsQuery
6063mb Remaining
(note: database has been cleared)
I haven't figured out what exactly is causing it to start consuming all the RAM, but I can reproduce it consistently on my project. (apologies for not having a minimal reproduction example).
The issue perhaps seems to be perhaps caused by the
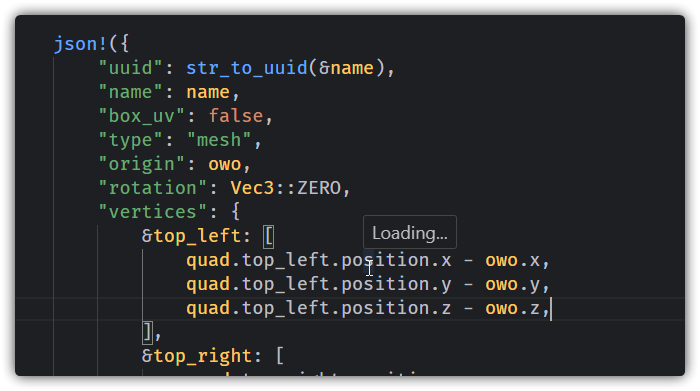
json!macro, since attempting to hover any variables inside it causes r-a to get stuck.Steps:
utils\nmsr-rendering-blockbench-model-generator-experiment\src\blockbench\model.rsjson!macroworld burnRAM being consumedrust-analyzer version: (eg. output of "rust-analyzer: Show RA Version" command, accessible in VSCode via Ctrl/⌘+Shift+P)
rust-analyzer version: 0.4.1761-standalone (bc9c952 2023-12-07)
rustc version: (eg. output of
rustc -V)rustc 1.74.0 (79e9716c9 2023-11-13)
relevant settings: (eg. client settings, or environment variables like
CARGO,RUSTC,RUSTUP_HOMEorCARGO_HOME){ "rust-analyzer.cargo.features": [ "ears", "part_tracker" ], "rust-analyzer.assist.emitMustUse": true, "rust-analyzer.procMacro.ignored": { "tokio-macros": [ "main" ], "axum": [ "debug_handler" ] }, "rust-analyzer.inlayHints.lifetimeElisionHints.enable": "skip_trivial", "rust-analyzer.inlayHints.lifetimeElisionHints.useParameterNames": true, "rust-analyzer.inlayHints.closingBraceHints.enable": false, "rust-analyzer.inlayHints.expressionAdjustmentHints.enable": "reborrow", "rust-analyzer.inlayHints.expressionAdjustmentHints.hideOutsideUnsafe": true, "rust-analyzer.inlayHints.reborrowHints.enable": "mutable", "rust-analyzer.imports.prefix": "crate", "rust-analyzer.imports.granularity.enforce": true, "rust-analyzer.check.allTargets": false, "rust-analyzer.inlayHints.implicitDrops.enable": true, "rust-analyzer.diagnostics.experimental.enable": false, }The text was updated successfully, but these errors were encountered: