-
Building a grid of subplots is mainly intuitive and requires simply the use of the
subplots()method, to construct a grid ofrowsxcolssubplots, and thesubplot()method to access a specific subplot at the givenrowandcol(counting from the upper left corner of the matrix of plots and starting from 1) and define what and how to plot data in it. -
The
main()method returns the main figure at the uppermost level, and sets the active figure to it (as by default); any further commands will refer to the entire figure and to any of its subplots, if present. -
The
active()method returns the active subplot. -
The
plot_size()method sets the plot size of the active subplot (in units of character size), as explained here. -
The final widths/heights of a matrix of subplots will be the same for each column/row. By default, the maximum is taken, use
take_min()to take the minimum instead. -
Most of the commands referring to the active subplot, could be also passed directly to the
subplot()method; for examplesubplot(1, 3); plotsize(100, 30)becomessubplot(1, 3).plotsize(300, 30). -
Subplots can be nested such that any subplot could creates its own matrix of subplots. For example, to create a 2 by 2 matrix where the first subplot is itself a 3 by 4 matrix, use
subplots(2, 2); subplot(1, 1); subplots(3, 4)or directlysubplots(2, 2).subplot(1, 1).subplots(3, 4). -
Any method referring to a subplot, which itself is a matrix of subplots, will apply to all of them simultaneously. This is useful to avoid rewriting the same code for each element of the matrix.
Here is a coded example, which requires the package yfinance and where a test image is downloaded in the home folder, visualized and finally removed:
import plotext as plt
import random
import yfinance as yf

plt.date_form('d/m/Y')
start = plt.string_to_datetime("11/07/2020")
end = plt.today_datetime()
data = yf.download('goog', start, end)
dates = plt.datetimes_to_strings(data.index)
p = ["Sausage", "Pepperoni", "Mushrooms", "Cheese", "Chicken", "Beef"]
mp = [14, 36, 11, 8, 7, 4]
fp = [12, 20, 35, 15, 2, 1]
hd = [random.gauss(1, 1) for el in range(3 * 10 ** 5)]

path = 'cat.jpg'
plt.download(plt.test_image_url, path)

plt.clf()
plt.subplots(1, 2)
plt.subplot(1, 1).plotsize(plt.tw() // 2, None)
plt.subplot(1, 1).subplots(3, 1)
plt.subplot(1, 2).subplots(2, 1)
plt.subplot(1, 1).ticks_style('bold')

plt.subplot(1, 1).subplot(1, 1)
plt.theme('windows')
plt.candlestick(dates, data)
plt.title("Google Stock Price CandleSticks")

plt.subplot(1, 1).subplot(2, 1)
plt.theme('dreamland')
plt.stacked_bar(p, [mp, fp], labels = ["men", "women"])
plt.title("Most Favored Pizzas in the World by Gender")

plt.subplot(1, 1).subplot(3, 1)
plt.theme('matrix')
bins = 18
plt.hist(hd, bins, label = "Gaussian Noise Distribution", marker = 'fhd')
plt.yfrequency(0)
plt.title('Histogram Plot')

plt.subplot(1, 2).subplot(1, 1).title('Default Theme')
plt.plot(plt.sin(periods = 3), marker = "fhd", label = "3 periods")
plt.plot(plt.sin(periods = 2), marker = "fhd", label = "2 periods")
plt.plot(plt.sin(periods = 1), marker = "fhd", label = "1 period")

plt.subplot(1, 2).subplot(2, 1)
plt.plotsize(2 * plt.tw() // 3, plt.th() // 2)
plt.image_plot(path)
plt.title("A very Cute Cat")

plt.show()
plt.delete_file(path)
or directly on terminal:
python3 -c "import plotext as plt; import random; import yfinance as yf; plt.date_form('d/m/Y'); start = plt.string_to_datetime('11/07/2020'); end = plt.today_datetime(); data = yf.download('goog', start, end); dates = plt.datetimes_to_strings(data.index); p = ['Sausage', 'Pepperoni', 'Mushrooms', 'Cheese', 'Chicken', 'Beef']; mp = [14, 36, 11, 8, 7, 4]; fp = [12, 20, 35, 15, 2, 1]; hd = [random.gauss(1, 1) for el in range(3 * 10 ** 5)]; path = 'cat.jpg'; plt.download(plt.test_image_url, path); plt.clf(); plt.subplots(1, 2); plt.subplot(1, 1).plotsize(plt.tw() // 2, None); plt.subplot(1, 1).subplots(3, 1); plt.subplot(1, 2).subplots(2, 1); plt.subplot(1, 1).ticks_style('bold'); plt.subplot(1, 1).subplot(1, 1); plt.theme('windows'); plt.candlestick(dates, data); plt.title('Google Stock Price CandleSticks'); plt.subplot(1, 1).subplot(2, 1); plt.theme('dreamland'); plt.stacked_bar(p, [mp, fp], labels = ['men', 'women']); plt.title('Most Favored Pizzas in the World by Gender'); plt.subplot(1, 1).subplot(3, 1); plt.theme('matrix'); bins = 18; plt.hist(hd, bins, label = 'Gaussian Noise Distribution', marker = 'fhd'); plt.yfrequency(0); plt.title('Histogram Plot'); plt.subplot(1, 2).subplot(1, 1).title('Default Theme'); plt.plot(plt.sin(periods = 3), marker = 'fhd', label = '3 periods'); plt.plot(plt.sin(periods = 2), marker = 'fhd', label = '2 periods'); plt.plot(plt.sin(periods = 1), marker = 'fhd', label = '1 period'); plt.subplot(1, 2).subplot(2, 1); plt.plotsize(2 * plt.tw() // 3, plt.th() // 2); plt.image_plot(path); plt.title('A very Cute Cat'); plt.show(); plt.delete_file(path);"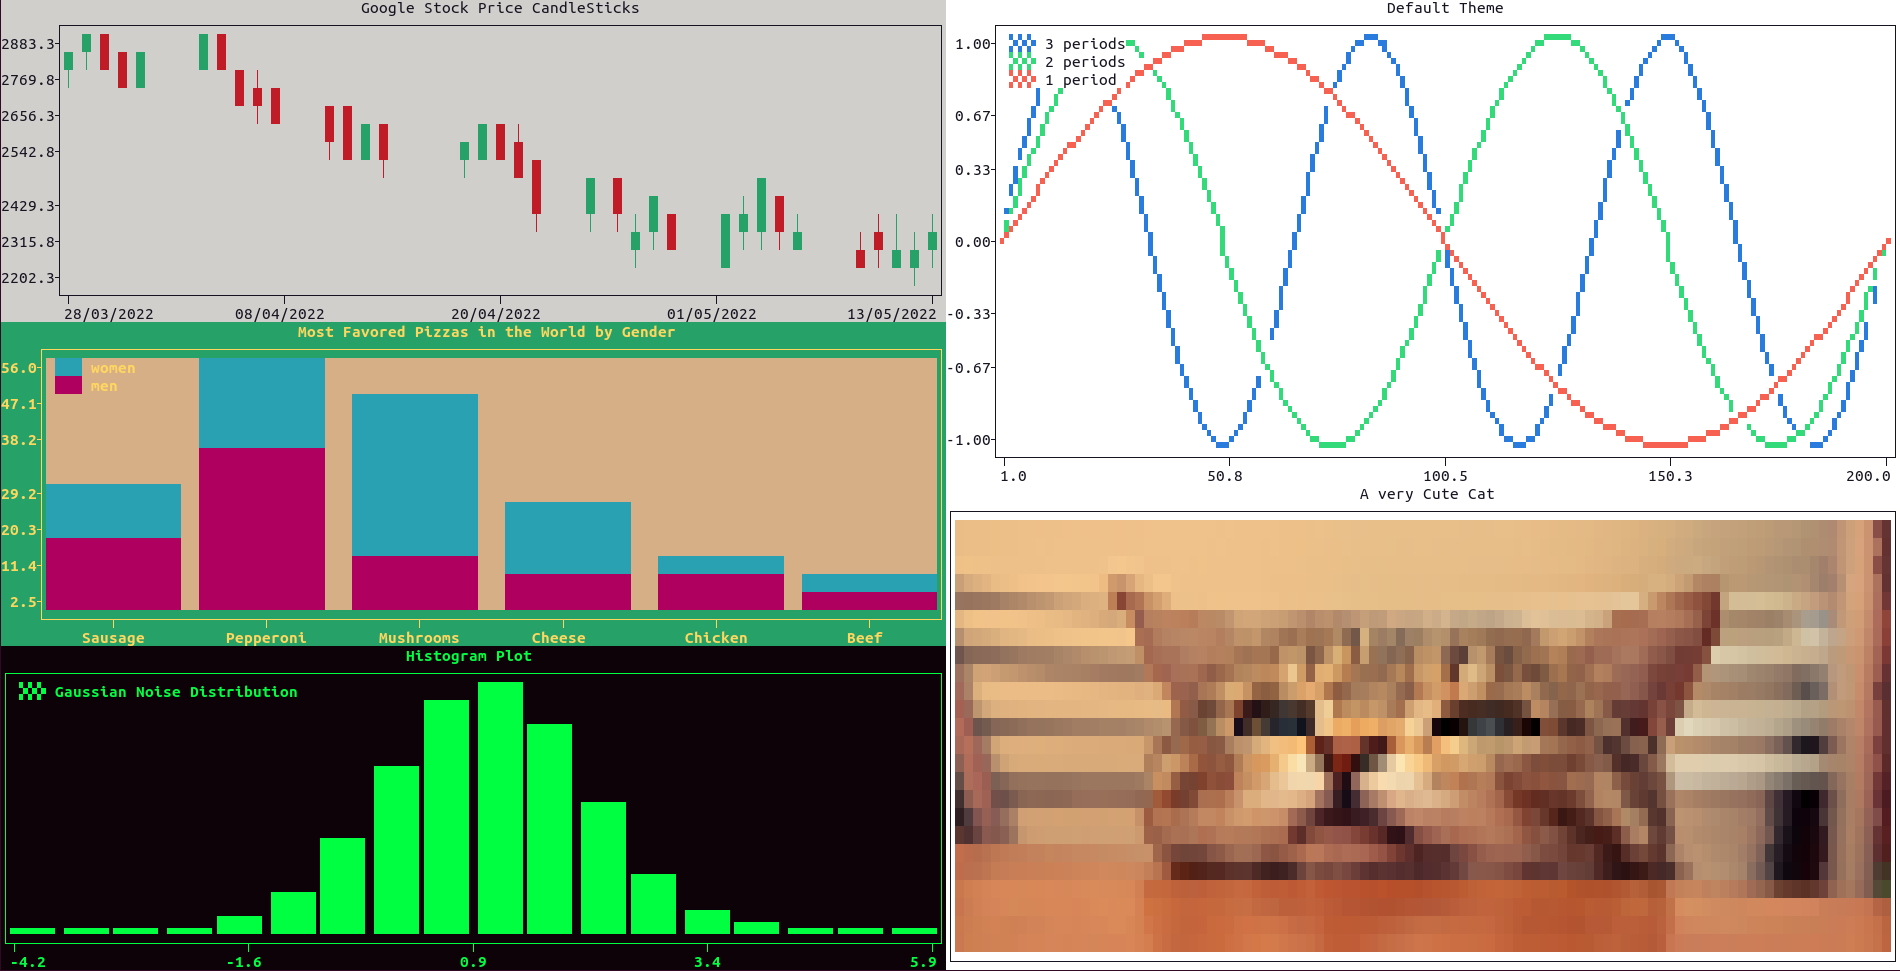
More documentation is available accessing the doc-strings of the relevant methods; for example: doc.subplots() or doc.subplot().