Author: Hannes Månsson (id: hm222zv)
Time to complete build: 1-3 days
This tutorial walks through the steps of making a simple IoT-device that can monitor sun exposure, temperature and humidity of the environment around your plants. This tutorial was made as an assignment to a IoT-course at Linnaeus University. The project takes about 1 day to build and maybe 2 extra for setting up the digital infrastructure. It all depends on how comfortable you are with programming and if you have self-hosted services before.
Important
This tutorial assumes you have a basic knowledge of the concept of Internet Of Things (IoT). If not, here is a list of things you should do further reading on before preceding:
- What even is IoT ?
- Basics in computer networking.
- The MQTT protocol.
- What is a server?
- Optional: Basic electronics.
The inspiration for this project came to me when one of my plants in my window dried out from too much sun exposure. I wanted to make a device that can alert me if the sun exposure reaches above a certain threshold and also keep track of overall sun exposure over time. While I was at it, I thought, I might also check temperature and humidity data.
 Figure 1: The plant who started it all
Hopefully this data helps me understand how much sunlight my plants get and if I need to change something to make their habitat better.
Note
Spoiler alert! The sensor has helped me understand a lot about sun exposure! Who knew sun exposure could be so dependent on where the sun is in the sky? A cloudy day with the sun directly above the plants ARE WAY worse than a sunny evening. Science
Note
A lot of the materials I used in the project I had laying around since before. I realize now that the project can be a bit expensive if you have to buy all of these things at once, especially the Raspberry Pi. Just note that the Raspberry can host a lot of stuff and be used in multiple projects at once! You probably won't regret buying one!
Tip
A lot of the basic components such as LEDs and resistors are cheaper to buy in larger numbers. Might not hurt to order a few extra!
| Name | Picture | Where to buy | Amount | Price (as of 2024-06-25) | Used for | Note |
|---|---|---|---|---|---|---|
| Raspberry Pi Pico W | 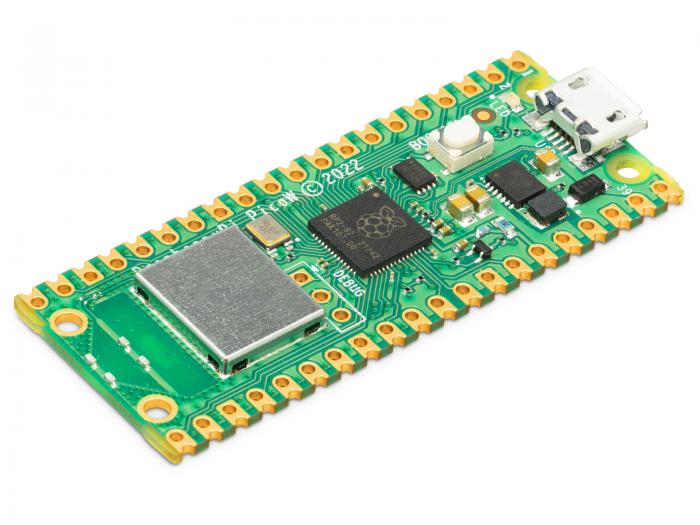 |
Link | 1 pcs | 89 SEK | Microcontroller who runs the code. Has built in WIFI and Bluetooth | You can use another micro controller if you want to. But I can't promise the rest of this tutorial will help you. |
| Digital temperature and humidity sensor DHT11 | 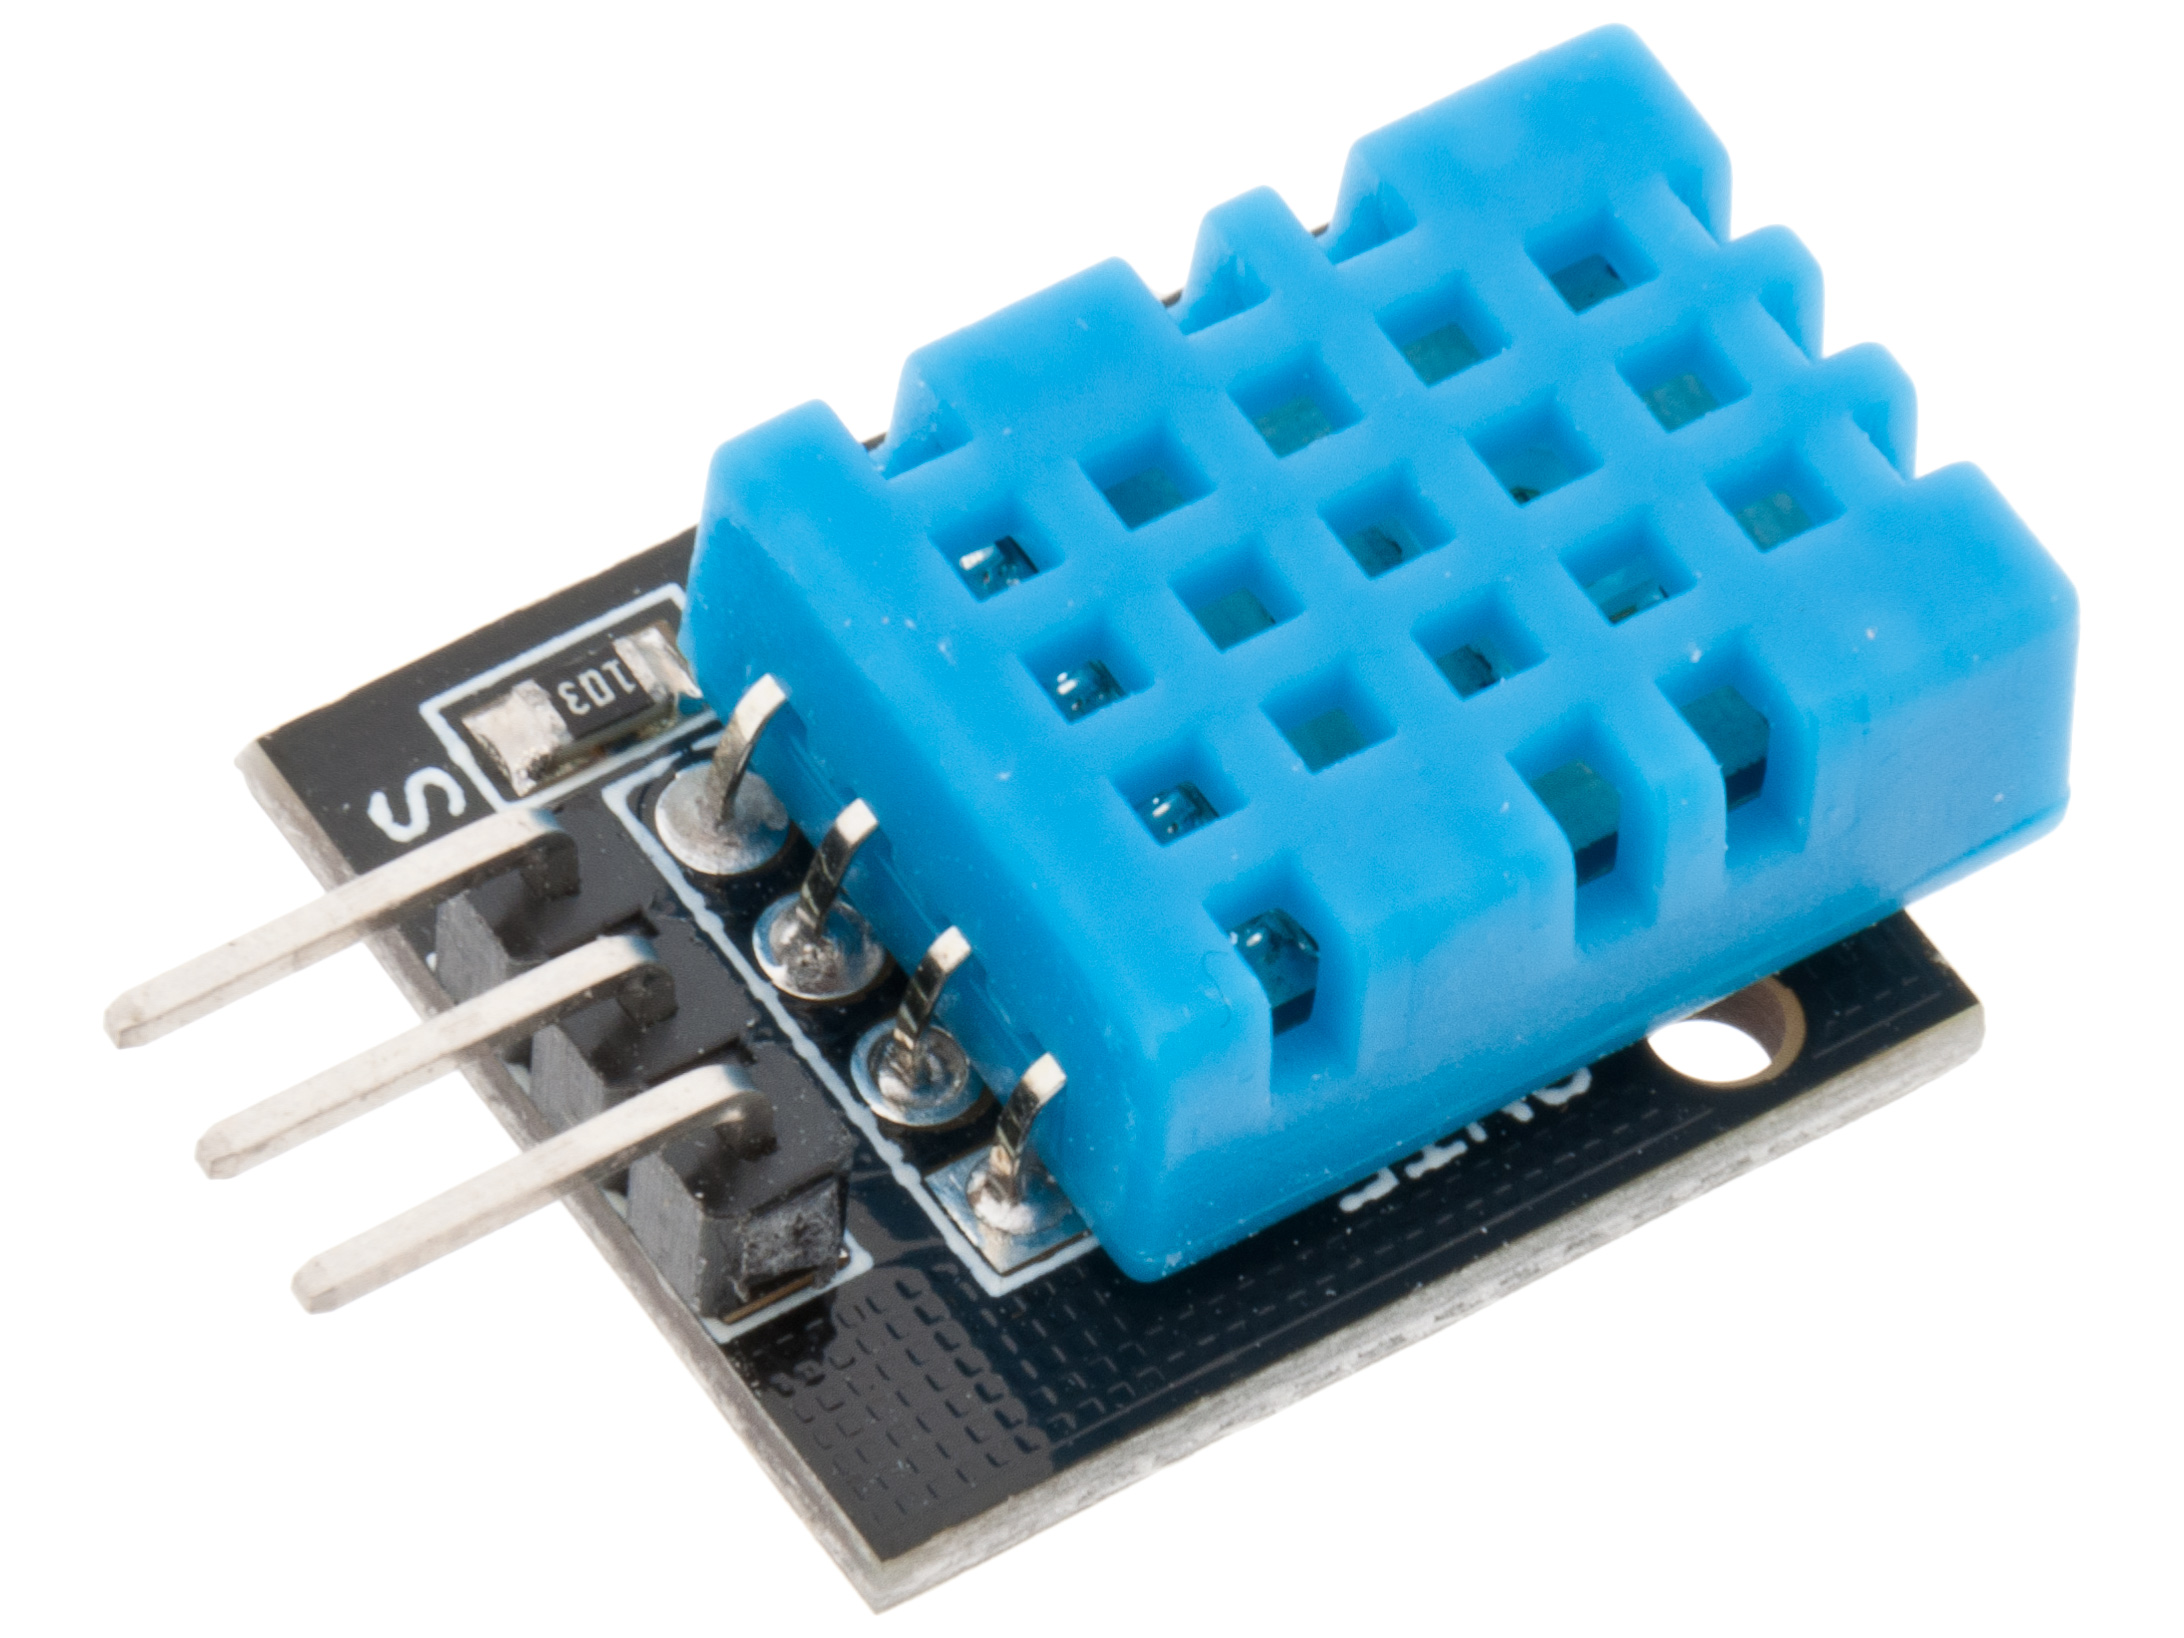 |
Link | 1 pcs | 49 SEK | Self-explanatory | |
| Photo resistor CdS 4-7 kohm | 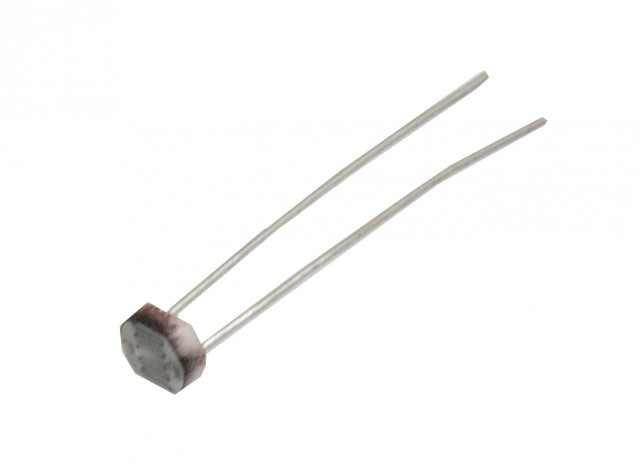 |
Link | 1 pcs | 8 SEK | Resistor that changes resistance depending on the amount of light hitting it. | |
| NPN transistor | 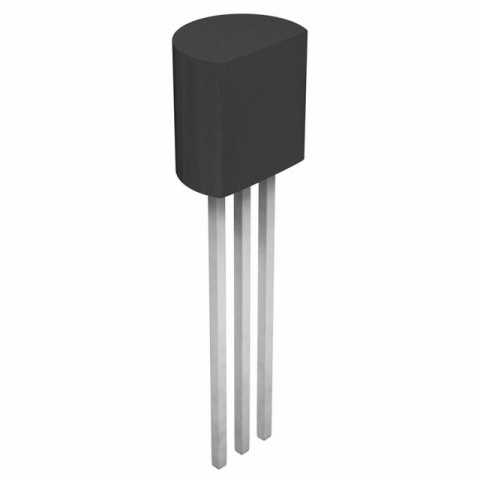 |
Link | 1 pcs | 3 SEK | Used in the logic in the sunshine sensor | |
| Trimpot 3386P 10 kohm | 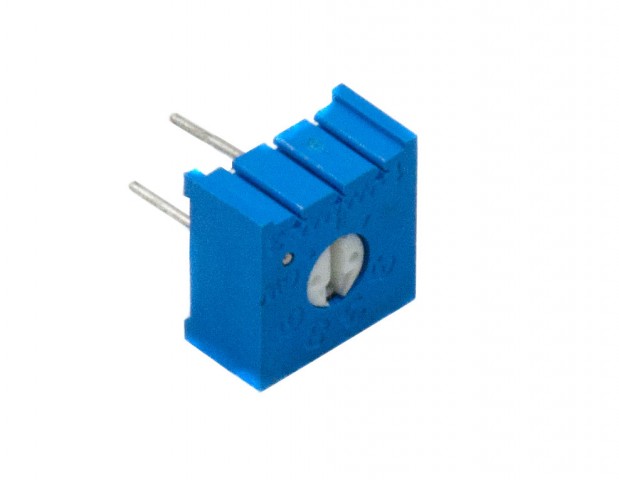 |
Link | 1 pcs | 9.5 SEK | Variable resistor. Used for "tuning" the sensor. | |
| LED 3mm red low current 2mA TLLR4401 | 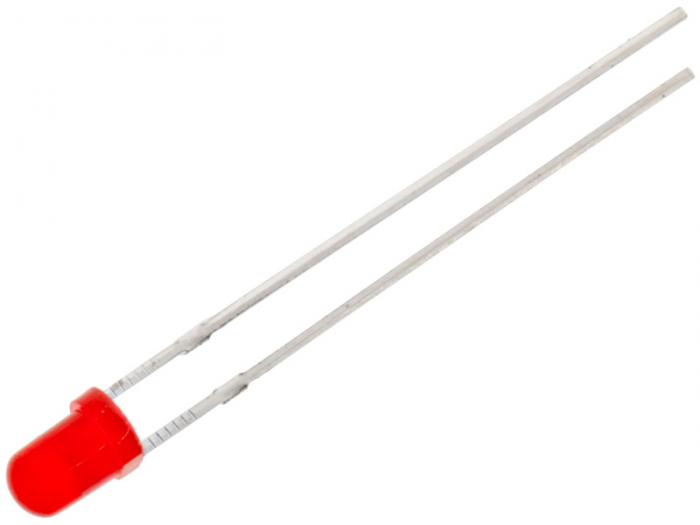 |
Link | 1 pcs | 9 SEK | Used as an indicator | |
| 0.47 kohm resistor |  |
Link | 2 pcs | 3 SEK | Any 4.7 kohm resistor works | |
| 94 kohm resistor |  |
Link | 1 pcs | 3 SEK | The key here is that 94 is much much bigger than 0.47. Any resistor much larger than 0.47 works. | |
| Wires male-to-male | 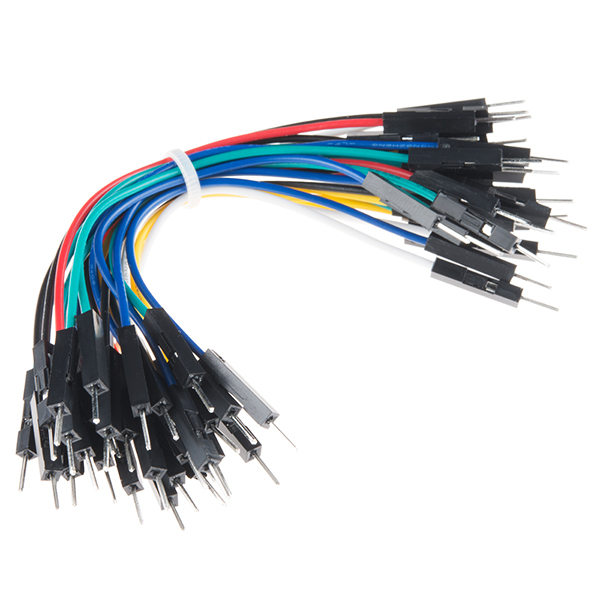 |
Link | 30 pcs | 39 SEK | Your layout on the breadboard is up to you. But you will probably not need more than 30 wires | |
| Breadboard | 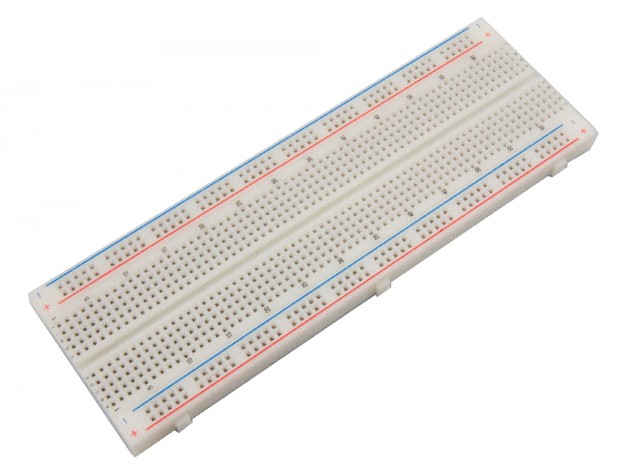 |
Link | 1 pcs | 69 SEK | For connecting everything | What I recommend. Should be plenty of room. |
| Buzzer (optional) | 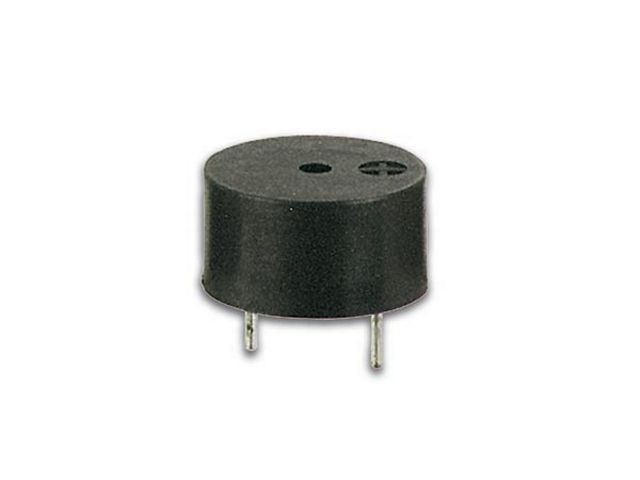 |
Link | 1 pcs | 28.45 SEK | Used as an indicator | An extra sound indicator. |
Note
In this project I have chosen to self-host everything. To host the servers, you are going to need a computer on your network that is running at all times. More precisely in this tutorial, a computer running a Linux OS. I have chosen to host my project on a Raspberry Pi 3b+ I had laying around. If you do not already have a computer hosting stuff on your network, buying a Raspberry Pi is what I recommend.
| Part | Picture | Where to buy | Amount | Price (as of 2024-06-25) | Note |
|---|---|---|---|---|---|
| Raspberry Pi 3b+ | 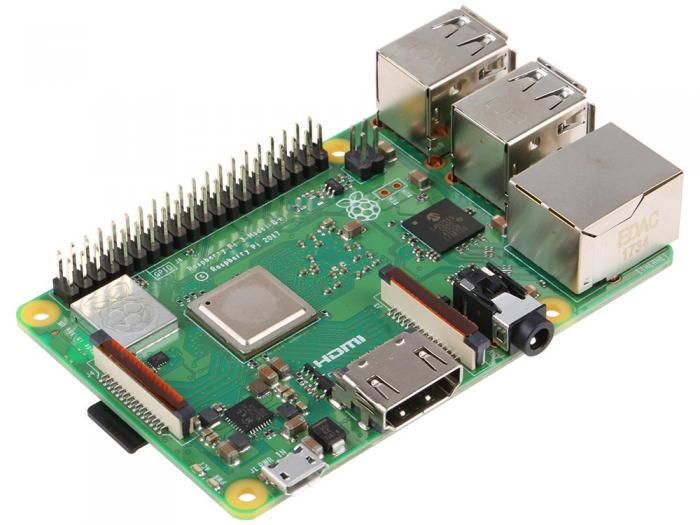 |
Link | 1 pcs | 499 SEK | What I've used. There are newer models and other brands work as well. Have built in WIFI. |
| SD-card 16 GB | 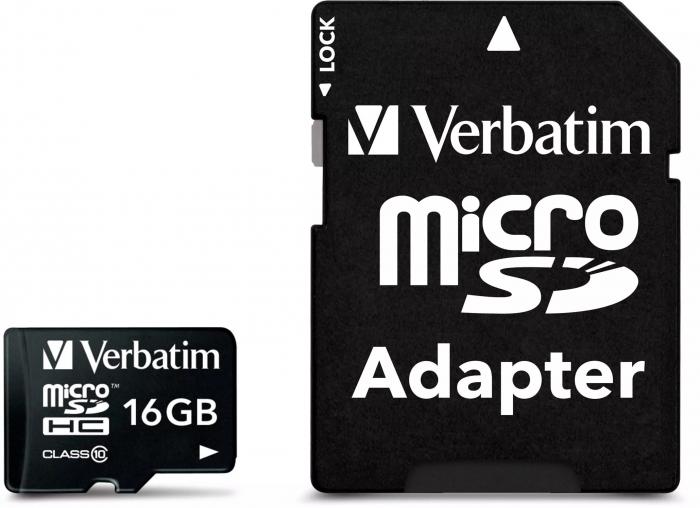 |
Link | 1 pcs | 129 SEK | Used for hosting the OS and long term memory. 16 GB should be plenty for this project. If you are planning on hosting other stuff on your raspberry you can buy SD-card with more storage. |
| Power supply | 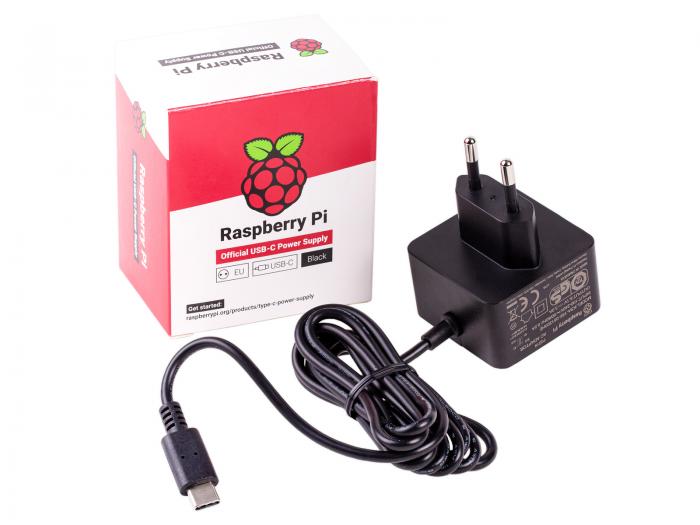 |
Link | 1 pcs | 99 SEK | Something like this. Any power supply rated the same works. |
The Pico W is the heart of the IoT-device and runs all the code and also sends the messages over the network. The Pico can be programmed with a lot of different programming languages. In this project the code is implemented in the language MicroPython. To write the program and write the code to the Pico Microsoft’s Visual Studio Code was used as the preferred IDE. Down below are the steps for getting started with writing code to your Pico if you are using Windows on your PC. The rough steps are the same if you using MAC. If you get stuck, do not be afraid to google around for help. There are a lot of helpful tutorials out there on the internet!
Important
If you are using Linux on your personal computer the steps for downloading and installing the packages can be made mostly from the terminal. If you are using Linux - I assume you know what you are doing and can manage yourself 😉
- We are going to use a plugin in VS Code that is dependent on Nodejs. Got to this website and download it. Run the downloaded file and follow the instructions in the installer.
- After flashing the Pico (which we will do later), MicroPython is supported natively on the Pico. However, if you want to run the code on your own computer first for testing purposes, you are going to need to install Python on your computer. Python can be downloaded and installed from here.
- Got the official download page for VS code and download the version for your specific OS . Run the downloaded file and follow the steps in the installer.
- The write the code to the Pico we are going to use an extension in VS Code that is called PyMakr. Go to the extensions tab in VS Code and search for PyMakr and install the first extension that shows up in the results.
We are now going to install the right firmware to the Pico so we can program it with MicroPython. This can be a bit tricky if you never done it before. I recommend watching a video of someone else doing it first. Download the firmware form this website. Have your Pico and a USB cable for connecting it to your computer ready. Then do the following:
- Connect the USB cable to the Pico. Do not connect the cable to your computer yet!
- While holding down the BOOTSEL button on your Pico, connect the other end of the USB cable to your computer. The Pico should show up on your computer as a regular USB drive. You are now allowed to release the BOOTSEL button.
- Drag and drop the .uf2 file you downloaded previously to the Pico. When the file is transferred the Pico will automatically disconnect itself.
Important
If everything went well the Pico should automatically disconnect itself from the computer! If it did not, somethings wrong and you will have to repeat the steps above.
Well done! We are now ready to upload the code to the Pico. I recommend you to play around a with your Pico and try to write your own code and upload it. This video goes through an example on how to write and upload code to your Pico using the PyMakr extension.
When you are feeling confident in writing code to the Pico, clone this GitHub repository to your computer and open the folder in VS Code.
Before writing my code to your Pico you are going to need to change some variables. In the main.py file, under "MQTT variables", change the variable MQTT_BROKER to the IP address of the computer that hosts/will host your MQTT broker on your network.
The Pico is going to be connect to your WIFI. Open the file keys.py.example and enter the name and the password to your WIFI. Then save the file as keys.py (remove .example at the end) in the same location.
You are also free to change the mapping of the pins if you want to. But in the rest of the tutorial, I am going to assume you do not.
When everything set you are free to upload the code to the Pico.
Tip
I have programmed the built in LED on the Pico as an indicator:
- Constant light = No WIFI/trying to connect to WIFI
- Flash = sent data to MQTT broker
So, it should go something like this when you connect your Pico to the power supply: The LED turns on and stays on for a few seconds, then the LED turns off and starts to flash every 5 seconds (the data is sent every 5 seconds)
Have the Pico connect to a terminal while setting up the sensor. Useful information about its state is printed to the terminal. Such as the connection to the WIFI or if a sensor is not connected properly.
The whole device can be split in 4 parts: The Pico, the sunshine sensor, the temperature and humidity sensor and the buzzer. I am not going to provide a diagram that shows you exactly where to put things on the breadboard; as it would be too messy. Everything except the sunshine detector is as straight forward as just connecting the device directly to the Pico.
Caution
Always disconnect the power supply when connecting the electronics together! Sudden changes in voltage and current can damage the components!
This sensor works as a standalone part and can be built without the Pico. Down below is the circuit diagram for the sensor. The LED is used as an indicator: when the LED is off it means it’s too bright. You can tune the sensor with the potentiometer. A more in depth explanation on How the sunshine sensor works can be found at the end of this tutorial.
 Figure 2: Diagram for the sunshine sensor
Tip
You can use the built in 3.3 V power supply from the Pico when building the sunshine sensor.
Important
The tuning of the sensor only gets you that far. The sensor is designed for sensing the difference between normal daylight and very bright sunlight. If you want to change the range, for example use it as a day/night sensor; switch the 470 ohm resistor (above the potentiometer) for a higher value resistor around 5 kohm.
- Connect the ground in the diagram to one of the ground pins on the Pico (all grounds can share the same pin).
- Connect the Vcc supply to the built in 3.3 V power supply on the Pico (same here, both Vcc can share the same pin)
- Connect the node marked Vs in the diagram to Pin 15 on the Pico.
This one is very straight forward. The DHT11 sensor has 3 pins: GROUND, POWER and SIGNAL. Study the data sheet from where you bought it to figure out which is which.
- Connect GROUND pin to one of the Picos ground pins.
- The POWER pin to the Picos 3.3 V power supply.
- The SIGNAL pin to Pin 27 on the Pico.
The buzzer generates a tone when the sunshine is too bright.
- Connect one pin to ground
- Connect the other to Pin 5 on the Pico.
If you do not want the buzzer, you can just skip this step.
As mentioned before, the whole solution is self-hosted on a Raspberry Pi on my own network. Mostly because I care about privacy. I wanted to make it easy for myself and searched the web for a pre made docker-compose IoT-stack that can be used in my project. I stumbled upon this tutorial which was exactly what I needed. The tutorial is using this GitHub repository for installing the stack. The repository comes with a bash script that automatically builds the docker-compose yml file for you! The bash script also has options for backing up your data. Very easy to use!
Following the tutorial, I installed the stack which consist of:
- Mosquitto (MQTT Broker)
- Node-red (programming tool for connecting devices. In this case the MQTT Broker with the Influx Database)
- InfluxDB (Database)
- Grafana (For visualizing the data)
Important
You are going to need to set up a static IP address for your Raspberry Pi in your WIFI router. The process is different depending on what brand your router is. Search the web for your router brand and how to set up a static IP address.
Tip
I have hosted a lot of stuff on different Raspberrys before and have the infrastructure already set up. If it is your first time, I recommend watching a tutorial on how to set up a Raspberry with a simple web server. And maybe also on how to use docker-compose. Here is a good video for getting started with a fresh Raspberry Pi.
The code on the Pico is very simple. Half of the lines in the main.py file is mostly importing libraries and setting up constants. The reason the code is so small is because of the extensive use of libraries. The DHT11 library (which comes with MicroPython) makes the collecting of the data from the DHT11 sensor as easy as just running a function - no need for setting up communications with the sensor yourself. The umqttsimple library, found in the lib folder, manages all the communication with the MQTT protocol.
I would describe the code as consisting of 3 main functions/sections:
- the
connect_to_wifi()function - the
gather_data()function - and the main while loop
Down below is the main loop that runs indefinitely. I think the code is pretty straight forward, so I will not go through it step by step. But I am going to make some small remarks. I made sure that the code does not crash or halt if anything goes wrong. Notice the extensive use of try-catch blocks. If the device loses WIFI connecting it will enter another loop in the connect_to_wifi() function that tries to connect to the WIFI every 10 seconds. If the gather_data() function fails, maybe due to a sensor being disconnected, the code prints an error message and sends a message to the MQTT topic /collecting or /other - depending on if the error occurred collecting data or because of something else.
# THE MAIN LOOP
while (True):
    try:
        while (wlan.isconnected() == True):
            try:
                data = gather_data()  # data {temp, hum, sun}
                print(data)
            except:
                collecting += 1
                mqtt_client.publish(MQTT_TOPIC_ERROR_COLLECTING, str(collecting))
                print("Something went wrong in collecting data sleeping 5 ...")
                time.sleep(5)
            # sounding alarm if sun is too intense
            if (data['sunshine'] == 0):
                buzzer.duty_u16(1000)
            else:
                buzzer.duty_u16(0)
            # publish data
            led.toggle()
            json_string = json.dumps(data)
            mqtt_client.publish(MQTT_TOPIC_SENSOR, json_string)
            led.toggle()
            time.sleep(5)
        else:
            connect_to_wifi()
    except:
        other += 1
        mqtt_client.publish(MQTT_TOPIC_ERROR_OTHER, str(other))
        print("Something went wrong in collecting data sleeping 5 ...")
        time.sleep(5)
I also want to add a small note on the gather_data() function. If you studied the circuit diagram of the sunshine sensor you might realize the output Vs is the opposite of the LED indicator. I of course want them to be the same (LED on = True/1). That is why I invert the input in the code:
sun = (lightPin.value() + 1) % 2 #inverting input 1 becomes 0
Down below is a graph that describes how the whole project is connected together. The data from the DHT11 sensor is sent over a proprietary protocol managed by the DHT11 library using a physical wire. The sunshine sensor is just a simple HIGH or LOW voltage. The Pico sends the environment data every 5 seconds over WIFI using the MQTT protocol to the router. The router forwards the message to the Raspberry Pi where the Mosquito MQTT broker listens on that port. The data then takes two paths:
Node-red, which is on the same network (as in an internal docker network) as the mosquitto broker, pushes the data to the Influx Database. Grafana which can be accessed on the local network has access to the Influx Database.
The other path goes through a very simple API that I wrote myself that just forwards the data under the topic Pico/sensor from the MQTT broker. This API is open to the internet. In this way I can check my plants environment in real time anywhere on earth without having to expose the MQTT broker or Grafana to the internet. The whole reason for hosting everything myself was due to privacy, remember? I might want to use the MQTT broker and Grafana for other projects in the future and I do not want that data to be public.
 Figure 3: How the whole solution is connected
The data is visualized with a dashboard in Grafana. My dashboard consists of two sections. One for the real time data - showing the temperature and humidity right now and also if the sun exposure is okay right now. The other section shows the same data over time.
The data is sent to the database every 5 seconds. I did a rough calculations and the amount of storage space the data will take up. In my lifetime it will never succeed 4 GB. So, the data is stored forever.
 Figure 4: The dashboard in Grafana
I also made a simple web site that presents the real time data that is open to the internet. The simple back-end and front-end code can be found under the folder other.
 Figure 5: The simple website available on the internet at plant.hannes.pro
Thinking back on the project it went very well. I had some trouble making the sunshine sensor work at first and also had problems with the Picos code crashing. But with some patience and debugging I got everything working.
There is still room for improvement. The sunshine sensor draws more power than it needs to and there is probably a much better way of implementing it. In the future I would want to make 3D printed case for the sensor and solder it to something like a printed circuit board.
 Figure 6: The sensor hard at work
 |
 |
|---|
Figure 7: The sensor in shade vs in direct sunshine
In this example the potentiometer is not included as it does not really change anything in the explanation. If we assume the transistor is correctly biased, we can use the switch model (the transistor acts as switch either letting trough current or not).
Important
This is a very simple explanation on how the sunshine sensor works. Most of the facts I am saying here should be taken with a grain of salt. To explain the whole sensor in detail it would probably make the whole tutorial twice as long.
In the diagram below the photo resistor is in the dark making its resistance very high. This makes it so that almost all of the voltage falls over the photo resistor. The voltage at the base of the transistor is larger which makes the transistor turn on.
The red arrows show the path of the current. Since the node Vs is directly connected to ground through the transistor, the current will not take that path through the 100 kohm resistor.
Dark outside -> transistor on -> LED on -> Vs = 0
 Figure 8: Circuit diagram in the dark
In bright light the photo resistor almost has no resistance, making it act like a straight connection to ground. Now all of the voltage will fall over the 470 ohm resistor making the voltage at the base of the transistor 0. The transistor is turned off and the direct path to ground is cut off. The current must now take the path through the 100 kohm resistor. Since the 100 kohm is much much larger than 470 ohm, almost all of the voltage will fall over it. Making the potential in the node Vs equal to 3.3 V. No current will go through the LED since the voltage over it is 0 (LEDs has what is known as a forward voltage).
Bright light -> transistor off -> LED off -> Vs = 3.3 V
 Figure 9: Circuit diagram in bright light