The scope of this document is to describe how to setup the annotations needed for Prometheus to use Kubernetes SD to discover & scape kube-router pods. For help with installing Prometheus please see their docs
Metrics options:
  --metrics-path        string               Path to serve Prometheus metrics on ( default: /metrics )
  --metrics-port        uint16 <0-65535>     Prometheus metrics port to use ( default: 0, disabled )
To enable kube-router metrics, start kube-router with --metrics-port and provide a port over 0
Metrics is generally exported at the same rate as the sync period for each service.
The default values unless other specified is iptables-sync-period - 1 min ipvs-sync-period - 1 min routes-sync-period - 1 min
By enabling Kubernetes SD in Prometheus configuration & adding required annotations Prometheus can automaticly discover & scrape kube-router metrics
kube-router 0.1.0-rc2 and upwards supports the runtime configuration for controlling where to expose the metrics. If you are using a older version, metrics path & port is locked to /metrics & 8080
The following annotations can be set on pods/services to enable automatic SD & scraping
prometheus.io/scrape: Only scrape services that have a value oftrueprometheus.io/path: If the metrics path is not/metricsoverride this.prometheus.io/port: If the metrics are exposed on a different port to the
They are to be set under spec.template.metadata
For example:
spec:
  template:
    metadata:
      labels:
        k8s-app: kube-router
      annotations:
        prometheus.io/scrape: "true"
        prometheus.io/port: "8080"
If metrics is enabled only the running services metrics are exposed
The following metrics is exposed by kube-router prefixed by kube_router_
- controller_bgp_peers Number of BGP peers of the instance
- controller_bgp_advertisements_received Number of total BGP advertisements received since kube-router start
- controller_bgp_internal_peers_sync_time Time it took for the BGP internal peer sync loop to complete
- controller_iptables_sync_time Time it took for the iptables sync loop to complete
- controller_ipvs_services_sync_time Time it took for the ipvs sync loop to complete
- controller_ipvs_services The number of ipvs services in the instance
- controller_ipvs_metrics_export_time The time it took to run the metrics export for IPVS services
- service_total_connections Total connections made to the service since creation
- service_packets_in Total n/o packets received by service
- service_packets_out Total n/o packets sent by service
- service_bytes_in Total bytes received by the service
- service_bytes_out Total bytes sent by the service
- service_pps_in Incoming packets per second
- service_pps_out Outgoing packets per second
- service_cps Connections per second
- service_bps_in Incoming bytes per second
- service_bps_out Outgoing bytes per second
To get a grouped list of CPS for each service a Prometheus query could look like this e.g:
sum(kube_router_service_cps) by (namespace, service_name)
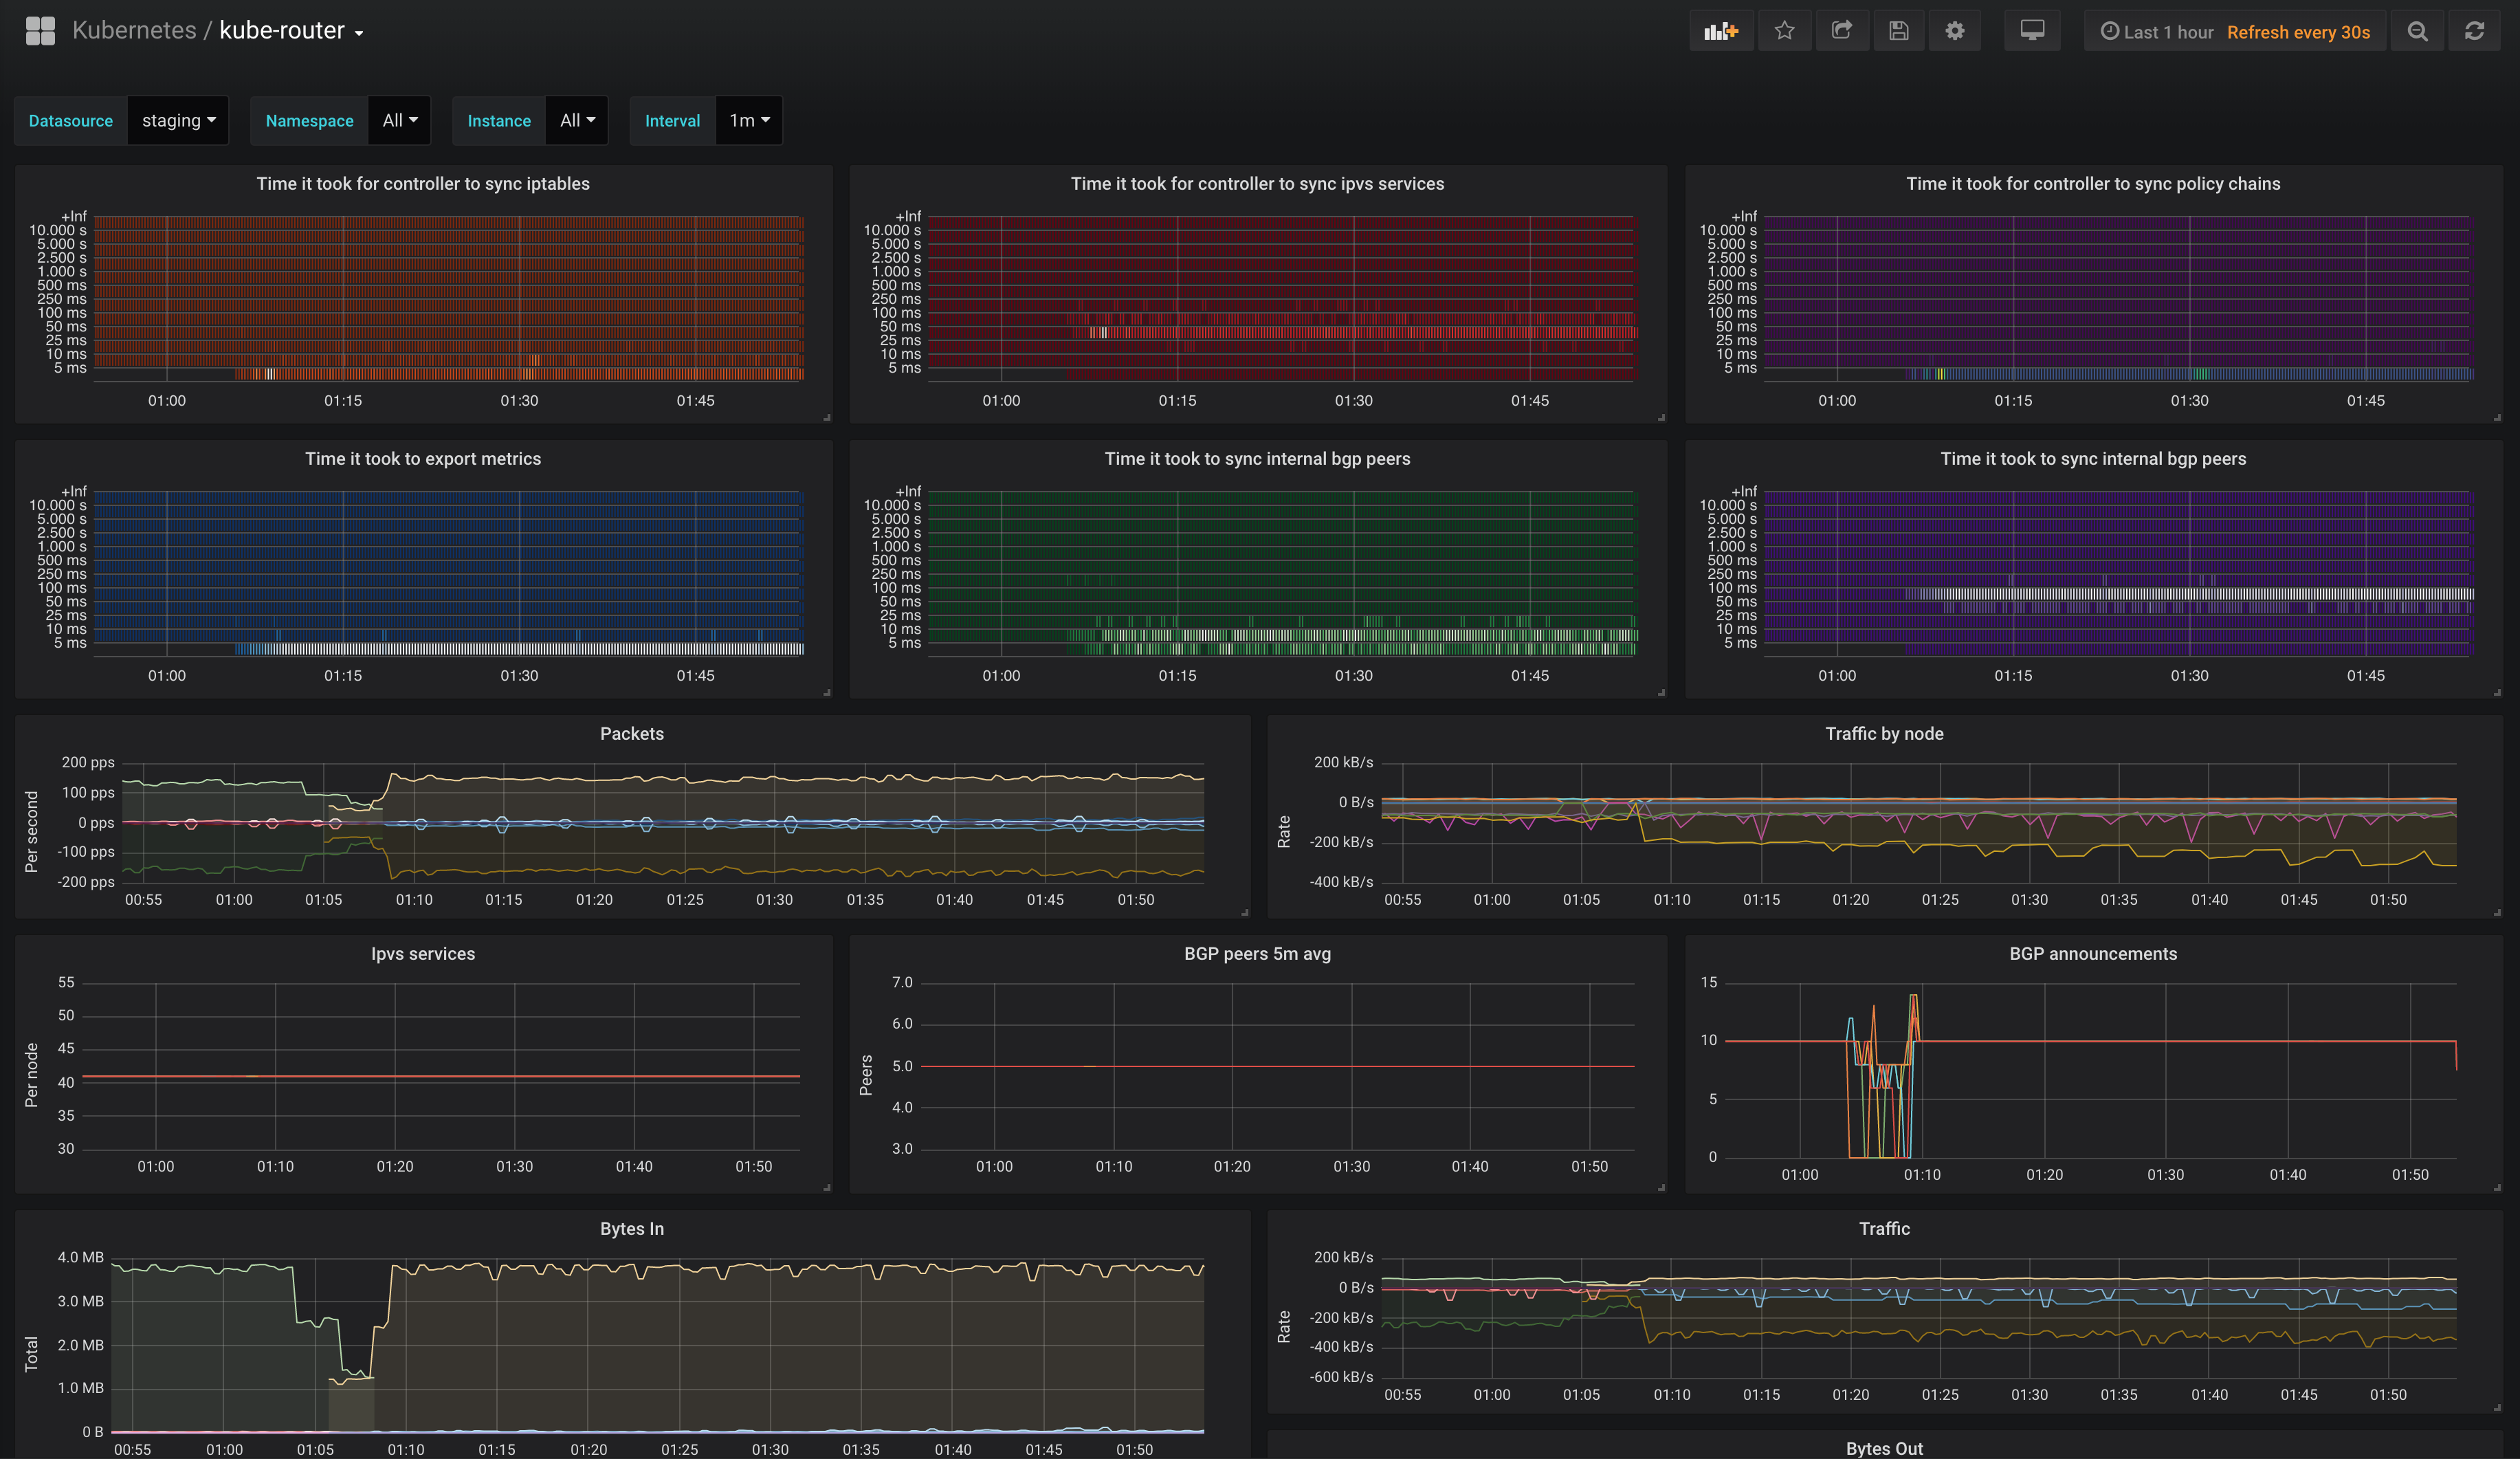
This repo contains a example Grafana dashboard utilizing all the above exposed metrics from kube-router.