ApexApartment is an innovative condominium management project aimed at enhancing the quality of life and residential experience in upscale residential areas. With a mission to create a harmonious, peaceful, and convenient living environment, ApexApartment combines modern technology and attentive resident care services to provide the best living experience for all residents.
- 📒Project Report
- 🏛️Technology Architecture
- 💻 VMs
- ⏱️Monitoring
- 📝Logging
- 🛠️Prerequisites
- 🚀Getting Started
- 📧Contact
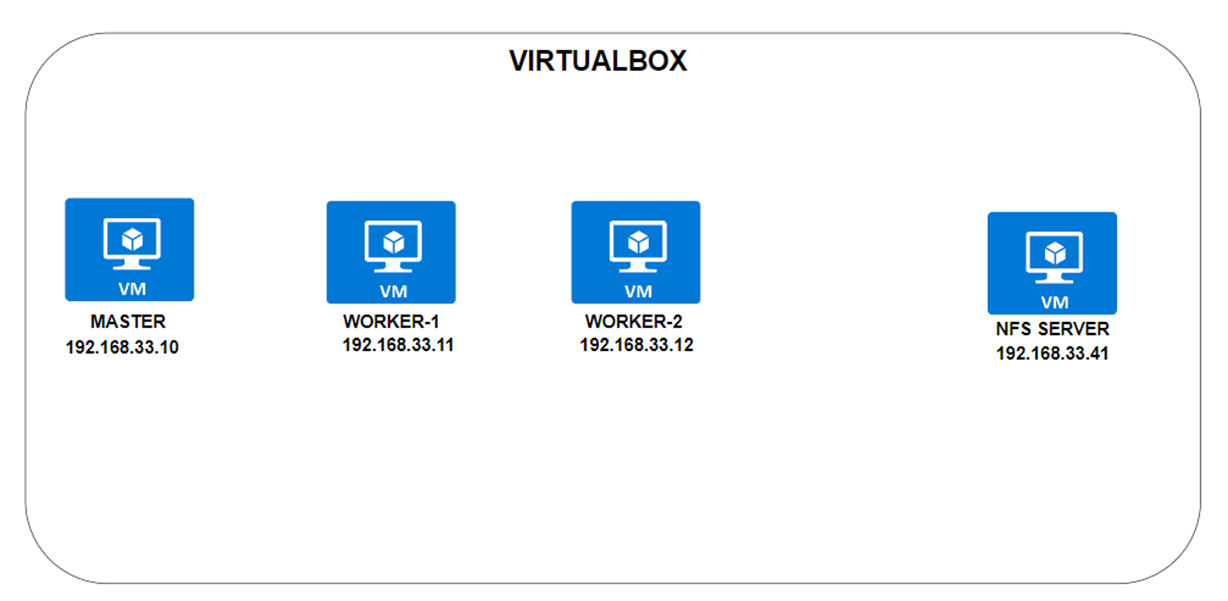
- The project includes a Kubernetes cluster with 3 nodes to ensure high availability and fault tolerance for containerized applications. Each node in the cluster contributes to the overall performance and reliability. Additionally, a dedicated NFS (Network File System) server is set up to provide shared storage across the cluster. This NFS server ensures consistent and accessible storage for persistent data and configuration files. The integration of the NFS server with the Kubernetes cluster supports efficient data management and application continuity.
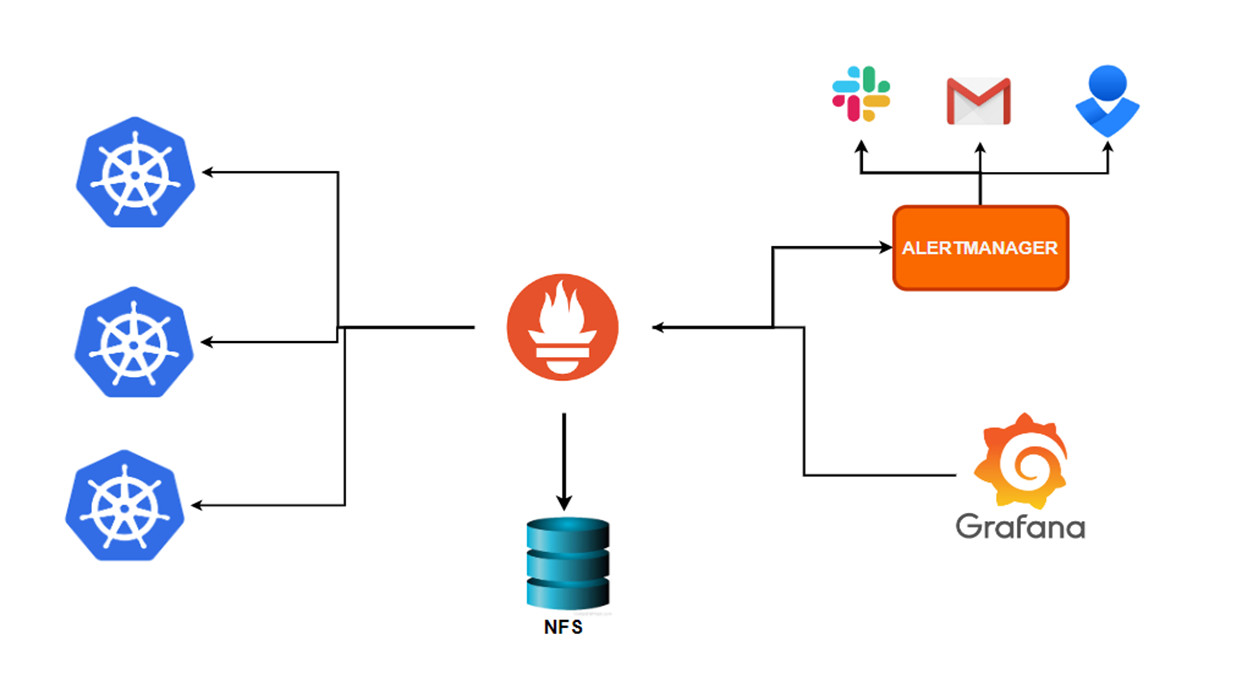
- This project utilizes Prometheus for comprehensive metrics collection and Grafana for visualization and dashboarding. Prometheus monitors various system and application metrics, providing detailed insights into performance and health. Grafana integrates with Prometheus to create customizable and interactive dashboards. Alerts are configured to notify you of any anomalies or critical issues, with notifications sent through Slack to ensure timely responses.
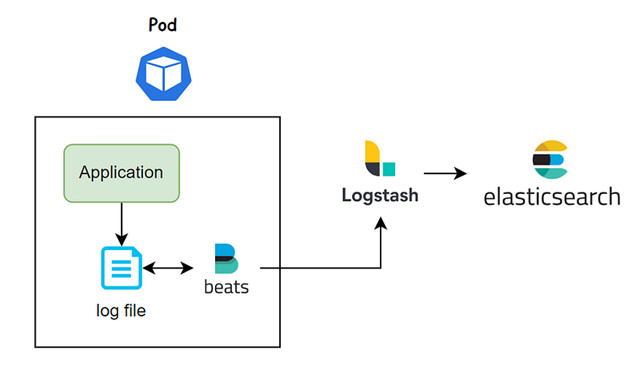
- For logging, the project utilize the ELK Stack (Elasticsearch, Logstash, Kibana). Elasticsearch stores and indexes logs, making them easily searchable and analyzable. Logstash processes and forwards log data from various sources to Elasticsearch. Kibana provides a powerful interface for visualizing log data, enabling effective monitoring and troubleshooting. This setup ensures a robust and scalable logging solution for tracking application and system events.
- To run this project, ensure that your computer has a multi-core processor (4 cores or more), at least 12 GB of RAM, and 100 GB of SSD storage.
Don't hesitate to contact me if you have any confusion or questions.
🔼 Back to top


