Skip to content
New issue

Have a question about this project? Sign up for a free GitHub account to open an issue and contact its maintainers and the community.

By clicking “Sign up for GitHub”, you agree to our terms of service and privacy statement. We’ll occasionally send you account related emails.

Already on GitHub? Sign in to your account

[Feature request]: 2D Value Graph #7

Open
matiasvlevi opened this issue Sep 6, 2021 · 0 comments
Open

[Feature request]: 2D Value Graph #7

matiasvlevi opened this issue Sep 6, 2021 · 0 comments
Labels
good first issue Good for newcomers

Comments

@matiasvlevi
Copy link
Owner

matiasvlevi commented Sep 6, 2021

We already have a neural network graph, but how about a 2d graph for values suck as accuracy of loss?

Here are some examples of what I had in mind :

Creation

let graph = new p5.valueGraph(x, y, w, h);

updating/adding a value to the curve

graph.update('accuracy', acc);
graph.update('loss', loss);

Customizing appearance, it would be nice to use the same themes as p5.NetGraph

graph.setTheme(CLASSIC);

The graph should also change its bounds once a value breaks through the current bounds in order to keep the last value added visible


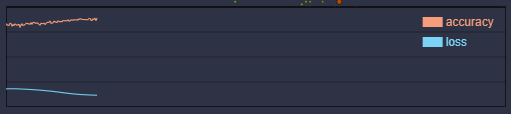
Here is an example of what the 2d graph could look like:
graph

@matiasvlevi matiasvlevi added the good first issue Good for newcomers label Sep 6, 2021
Sign up for free to join this conversation on GitHub. Already have an account? Sign in to comment
Labels
good first issue Good for newcomers
Projects
None yet
Development

No branches or pull requests

1 participant