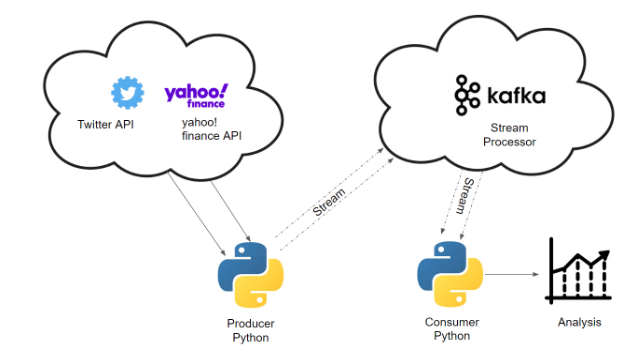
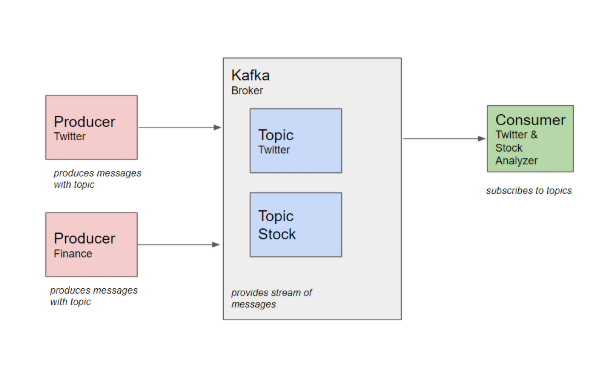
Several data sources are combine and streamed the stream processor Kafka to use Tweets and financial Stock data and combine them to find out if there are some correlations.
We wanted to find out a relation between twitter and stock market price we took the following metrics:
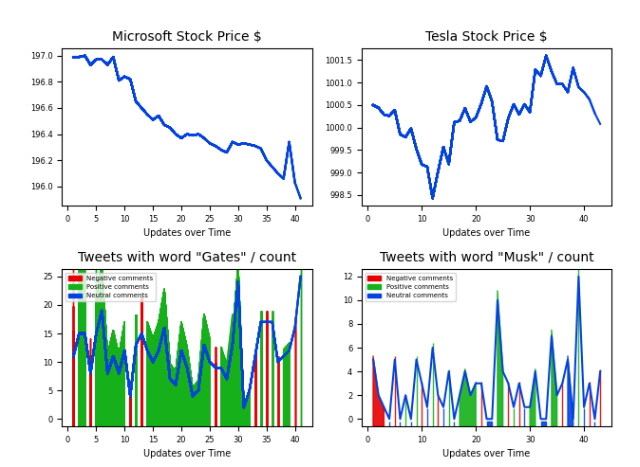
Stock market price in USD Amount of tweets per time Calculate average sentiment of the tweets per time (from -1 to 1) average sentiment of the tweets and visualize in red (bad), green (good) or blue (neutral)
We combined and compared the output while it’s dynamically updating. Continuously get stock data on Microsoft Stock Continuously get stock data on Tesla Stock Continuously get all tweets containing the word “Gates” Continuously get all tweets containing the word “Musk” Continuously get the average sentiment of the tweets and visualize in red (bad), green (good) or blue (neutral)
https://github.com/jkwieser/twitter-stock-analyzer/blob/master/documentation-full-redacted.pdf
https://drive.google.com/file/d/1N5pd-8CPBhaRHsEU4Ra0RWMR9XPaDzMh/view?usp=sharing