Graph support #1829
Graph support #1829
Conversation
|
Looks like a great plan to me. |
|
@philippjfr Ping me when you think it is in a good state for me to test it out. |
6069bda
to
4998b64
Compare
|
@jbednar @jlstevens This is ready for a review round. You should probably also play with it a bit so you get a feel for it. I'll mostly be focusing on tests at this point. |
There was a problem hiding this comment.
Fabulous! I think this has turned out to be very clean and will be really nice for people to use. I had a variety of comments about the example notebook, mostly about things to make clear to the users how to do, but also possibly about the underlying support (not sure which).
Also, there's no example of mapping edge "weight" onto anything visible; is that supported?
And it would be useful to have a datashaded categorical example, with some large graph of edges broken into categories that show up as different colors; that always makes for pretty pictures that drive people to try to explore what the categories and network structures mean.
| "source": [ | ||
| "Visualizing and working with network graphs is a common problem in many different disciplines. HoloViews provides the ability to represent and visualize graphs very simply and easily with facilities for interactively exploring the nodes and edges of the graph, especially using the bokeh plotting interface.\n", | ||
| "\n", | ||
| "The ``Graph`` ``Element`` differs from other elements in HoloViews in that it consists of multiple sub-elements. The data of the ``Graph`` element itself are the abstract edges between the nodes, on its own this abstract graph cannot be visualized. In order to visualize it we need to give each node in the ``Graph`` a concrete ``x`` and ``y`` position in form of the ``Nodes``. The abstract edges and concrete node positions are sufficient to render the ``Graph`` by drawing straight-line edges between the nodes. In order to supply explicit edge paths we can also declare ``NodePaths``, providing explicit coordinates for each edge to follow.\n", |
There was a problem hiding this comment.
I know it's a bit late to be raising this, but is NodePaths really the best name here? To me that sounds like the paths of a node, whereas it's actually the paths of an edge, i.e. the path between two nodes. Why not EdgePaths (since I assume you are reserving "edge" for the logical connection, with no path information)?
| "To summarize a ``Graph`` consists of three different components:\n", | ||
| "\n", | ||
| "* The ``Graph`` itself holds the abstract edges stored as a table of node indices.\n", | ||
| "* The ``Nodes`` hold the concrete ``x`` and ``y`` positions of each node along with a node ``index``. The ``Nodes`` may also define any number of value dimensions, which can be revealed when hovering over the nodes or to color the nodes by.\n", |
There was a problem hiding this comment.
I'm not sure I quite get this. There are no Nodes unless they have x,y positions? And the Graph doesn't store nodes or anything about nodes unless it includes x,y positions? This doesn't seem right to me; shouldn't we be able to represent (even if not visualize) graphs that have nodes and information about nodes, but no positions?
There was a problem hiding this comment.
Thanks for the reminder, I still have to do some work around this. You will be able to pass in node information without positions in the constructor and it will add the positions automatically. Constructing an abstract Nodes object without positions doesn't make sense to me though.
There was a problem hiding this comment.
Done and example added.
There was a problem hiding this comment.
Just to clarify, is assigning positions to the nodes lazy, in that no positions will be assigned if no one ever tries to visualize it? If so, that sounds good.
There was a problem hiding this comment.
Computing a circular layout isn't expensive in time, but it is expensive in storage, at least for a sparse graph -- each node then gets two extra columns of data. I'm still not sure what either of you mean by "conditional"; conditional on what? I was suggesting that the element always be displayable, just that this extra data not be computed until precisely the point where it first needs to be displayed.
The use case I imagine for that is to declare a huge Graph but then use HoloViews machinery to select only a subset of it to make a much smaller Graph that you actually display. I'm not worried about pickling it, just about making the handy tools in HoloViews available without forcing the Graph to be something displayable, as that's a separate consideration.
There was a problem hiding this comment.
I was suggesting that the element always be displayable, just that this extra data not be computed until precisely the point where it first needs to be displayed.
Okay sure, I can make it a property which computes nodes the first time they are accessed, which will basically happen when you call any method.
There was a problem hiding this comment.
@jlstevens, is that ok? If you veto it, I won't object; up to you.
There was a problem hiding this comment.
If the idea of the property is simply to defer assigning positions in a way that you can't tell the positions weren't there all along (except by tracking memory usage) then that seems ok to me. I won't veto it and I'll let Philipp decide although it does strike me a little bit as being premature optimization for a case we don't have a real example of yet.
There was a problem hiding this comment.
Pushed it now, revert it if you do object.
| "#### Hover and selection policies\n", | ||
| "\n", | ||
| "Thanks to Bokeh we can reveal more about the graph by hovering over the nodes and edges. The ``Graph`` element provides an ``inspection_policy`` and a ``selection_policy``, which define whether hovering and selection highlight edges associated with the selected node or nodes associated with the selected edge, these policies can be toggled by setting the policy to ``'nodes'`` and ``'edges'``." | ||
| ] |
There was a problem hiding this comment.
Why do we have to choose? I can see why someone might want to restrict to one or the other, but can't we have the default be that if hit testing says i'm over a node, do the node hovering, and if not do the edge hovering? If that's possible, then people will almost never need to mess with this option; it will just usually do what they want.
There was a problem hiding this comment.
That's an issue to raise with bokeh.
There was a problem hiding this comment.
I swear there was an issue about this in bokeh but I can't find it now.
There was a problem hiding this comment.
I can raise one, but it's probably better if you do it, because you're down there using the bokeh implementation and can be very precise about what's there now and what you'd like to see.
| "source": [ | ||
| "%%opts Graph [tools=['hover']]\n", | ||
| "bezier_graph.opts(plot=dict(inspection_policy='edges'))" | ||
| ] |
There was a problem hiding this comment.
Can we have hover info about the edge? I don't see an example of that.
There was a problem hiding this comment.
Not currently, another issue to raise with bokeh.
There was a problem hiding this comment.
And these are issues you haven't already raised?
There was a problem hiding this comment.
No, we still don't have a way of efficiently storing additional edge information in HoloViews (although that is work I'll be doing for 1.9), so I haven't gotten around to this yet and won't in this PR.
There was a problem hiding this comment.
Ok. Please raise a separate issue for that and reference it in this PR, but then leave it open.
There was a problem hiding this comment.
Nevermind, the inspection_policy determines whether you can inspect nodes or edges and you can just add the edge information to the abstract graph edges, so this works now.
| "metadata": {}, | ||
| "source": [ | ||
| "#### Animating graphs" | ||
| ] |
There was a problem hiding this comment.
Animating graphs sounds like a great thing to include, but I don't see anything in this section about that. Can you add something that actually does animate a graph, e.g. while dragging a slider?
There was a problem hiding this comment.
Sure, I can add a different example.
There was a problem hiding this comment.
This one also could use the padding that helps the ones above. I guess auto-padding is only for 2.0?
There was a problem hiding this comment.
Unfortunately that's probably the case.
| "fb_nodes = hv.Nodes(pd.read_csv('../assets/fb_nodes.csv')).sort()\n", | ||
| "fb_graph = hv.Graph((edges_df, fb_nodes), label='Facebook Circles')\n", | ||
| "fb_graph = fb_graph.redim.range(x=(-0.05, 1.05), y=(-0.05, 1.05)).opts(style=dict(cmap=colors))\n", | ||
| "fb_graph" |
There was a problem hiding this comment.
Here the hover information seems like it should be "circle: 50", not "circle: circle50". I know that means the original data needs updating, but I do think that's important to avoid being confusing.
There was a problem hiding this comment.
Or it could be something like "group: circle50"...
There was a problem hiding this comment.
Also, seems like the hover should have something (even if we have to make it up) to indicate the specific identity of the node. I imagine these are anonymized, but presumably we need something like "identity: person2090" to show that we can use this information to learn not just what category it's in, but who it is (the node identity).
There was a problem hiding this comment.
If you pulled the latest version you should have the node index as well at least, is that sufficient?
There was a problem hiding this comment.
Ok, just pulled again and got the index info. Yes, that's helpful, but in general people won't only want an index, they'll want some sort of human-meaningful information. But that's presumably available if it's in a column, so we can just say that in words ("Hovering over the node will reveal the index of that node, along with any other columns of information about that node that are available")?
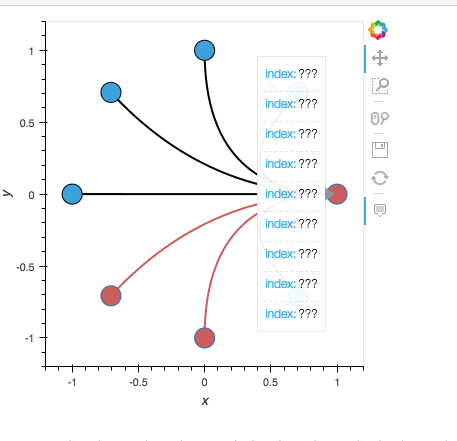
BTW, the index info isn't always coming out ok:
There was a problem hiding this comment.
That's pretty damn weird.
There was a problem hiding this comment.
The ??? isn't the only odd bit, it's odd that it's trying to show all the node ids at all. Maybe that's useful sometimes, but I'd guess probably not, since in general that can be a huge list and it's unclear what any of those other indexes would be (and unclear which is the one node I'm hovering over). Or maybe those are edge indexes. Confusing!
There was a problem hiding this comment.
Or maybe those are edge indexes.
I suspect that's it, in which case I can definitely fix it.
| "fb_graph = fb_graph.redim.range(x=(-0.05, 1.05), y=(-0.05, 1.05)).opts(style=dict(cmap=colors))\n", | ||
| "fb_graph" | ||
| ] | ||
| }, |
There was a problem hiding this comment.
I think we need to work on the visibility of the hovering. Right now, it's clear that nodes and edges are being selected, because they change color, but as soon as the mouse stops moving it is very difficult to see the difference between selected and unselected nodes and especially edges:


Here the selected node has a slightly different outline, which is very difficult to see, and the selected edges turn red, which is only visible because these happen to be on white; when they are in a complex nest it's super hard to make them out.
Can we make all the non-selected nodes and edges turn dim (Hunt's suggestion)? Or make the selected ones be much thicker than the rest, so that they actually stand out?
There was a problem hiding this comment.
Just checked, this is another thing to file with bokeh, the nonselection style options are not exposed at the moment.
There was a problem hiding this comment.
Ok, please do file those issues, and you can tag me if you need someone other than you to express a user-level opinion. But none of those things should hold up this PR.
There was a problem hiding this comment.
I was wrong, can probably get this working.
There was a problem hiding this comment.
I realize now what the issue was, there is no way of styling something that's not being hovered over. I can only customize non-selected nodes/edges, e.g. when using the tap or box_select tools.
There was a problem hiding this comment.
Here's what that looks like:

| "metadata": {}, | ||
| "source": [ | ||
| "## Datashading graphs" | ||
| ] |
There was a problem hiding this comment.
This plot isn't yet compelling. For one thing, the colorized edges don't really show up, which is partly because colors of fine lines are just never very visible, and partly because they are using the fire colormap, which is an inappropriate choice against a white background. Here the strongest bundles are colored yellow, which is very hard to see against white, thereby deemphasizing precisely the bits that should be most emphasized. I really think we need to get rid of the default "fire" colormap for datashader in HoloViews; it's almost never the right choice for the default white backgrounds.
In any case, this example isn't yet very compelling, perhaps because the data volume isn't high enough to need datashader in the first place. Maybe show the unbundled graph too, where the color shading can help make sense of the tangled thicket around the main clump of nodes?
There was a problem hiding this comment.
Since this is a user guide I don't think a larger dataset is workable. I agree about changing the color scheme, but do you think a larger dataset is required? I'd like to avoid switching to synthetic data.
There was a problem hiding this comment.
Well, try the non-bundled case; the effect of datashader's coloring should be clear there.
There was a problem hiding this comment.
It just looks very messy unfortunately, I've switched to 'linear' normalization, which means that the paths are mostly black. If we can get the nodes to line up I think this is reasonable.
| "cell_type": "markdown", | ||
| "metadata": {}, | ||
| "source": [ | ||
| "Alternatively we can select the nodes and edges by an attribute that resides on either. In this case we will select the nodes and edges for a particular circle and then overlay just the selected part of the graph on the datashaded plot. In this way a smaller subgraph can be highlighted and the larger graph can be datashaded." |
There was a problem hiding this comment.
This description sounds great, but I really couldn't make sense of the example; it's super hard to see what's datashaded and what isn't and what to make of it. Again I think that's probably because this dataset isn't sufficiently large for there to be a difference between what bokeh alone can do and what datashader can. Whatever it is, something needs to change for this to be a useful example.
There was a problem hiding this comment.
I can understand that visually it's not hugely compelling and a change in color schemes should help here, but is it really not clear conceptually? It's simply datashading everything and then overlaying part of the graph selected based on some criterion, which could be an attribute on either the edges or nodes.
There was a problem hiding this comment.
The concept is clear to me, but it's not clear visually -- I can't tell which bits are overlaid and which bits are datashaded. If I zoom quickly I can see that both are present, but I really can't visually get any idea which is which.
There was a problem hiding this comment.
The other issue is that bundling shifts the start and end points of the edges slightly (and sometimes significantly) so they don't line up with the nodes anymore. I'd expect bundling to leave the start and end points unaffected.
There was a problem hiding this comment.
@jbcrail ? I would also have expected bundling to leave nodes exactly where they are.
There was a problem hiding this comment.
@jbednar I would expect that also. A quick look at the code indicates at least two areas where the start and end points are resampled and modified.
@philippjfr Do you have an example? If so, could you put that into a datashader issue?
There was a problem hiding this comment.
@jbcrail Yes, I'll work up an example using the datashader API.
I agree, I think mapping a weight to an edge thickness/color is a very common case. |
|
BTW, is there any way to turn off the x,y locations of graph nodes by default for hovering? The location is usually not informative at all, given that the layout is from some algorithm instead of the data. |
Yes, I agree, not implemented yet. Any suggestion on plot options to control this? Ideally we'd have addressed that issue
I'll implement that. |
|
One thing that I think is missing from this PR are element notebooks documenting |
|
Yes, element notebooks and gallery examples are still missing. |
|
There is a fair bit of documentation work that needs doing. For this reason, I wouldn't mind merging this PR to get the code in place with a separate PR improving the docs. That PR could improve the user guide in the ways Jim has suggested and add the various other notebooks. |
|
I'd prefer to just do it in this PR tbh. Also have to add tests still. |
|
I agree we want tests! At least enough to turn coveralls green again. :-) |
b2ffc03
to
181f6d6
Compare
e6a329f
to
5e646d6
Compare
|
@jbednar @jlstevens I've now added Element reference and gallery examples for graphs, both are very similar to sections of the user guide and the element notebooks link to the user guide for further detail. |
|
Ok, looks great! Can you please look over our comments above, pull out anything that you haven't been able to deal with yet into an open issue, and then we can merge this? |
|
My to do list is basically:
|
06765b7
to
0ec07e0
Compare
| group = param.String(default='Nodes', constant=True) | ||
|
|
||
|
|
||
| class EdgePaths(Path): |
There was a problem hiding this comment.
I'm wondering whether it is worth introducing EdgePaths. Why not just use Path?
| Accepts a Graph and lays out the corresponding nodes with the | ||
| supplied networkx layout function. If no layout function is | ||
| supplied uses a simple circular_layout function. | ||
| """ |
There was a problem hiding this comment.
It's fine for this operation to live here for now. But if we end up with a bunch more operations, they should move to that module.
| return [df for df in np.split(path_df, splits) if len(df) > 1] | ||
|
|
||
|
|
||
| class bundle_graph(Operation, hammer_bundle): |
There was a problem hiding this comment.
Another graph operation ... but this time depending on datashader. Not sure where these should go...
| inspection_policy = param.ObjectSelector(default='nodes', objects=['edges', 'nodes', None], doc=""" | ||
| Determines policy for inspection of graph components, i.e. whether to highlight | ||
| nodes or edges when hovering over connected edges and nodes respectively.""") | ||
|
|
There was a problem hiding this comment.
Shorter names would be nice. Maybe select_by and inspect_by?
There was a problem hiding this comment.
Or select_mode and hover_mode?
| """ | ||
| Computes the node positions the first time they are requested | ||
| if no explicit node information was supplied. | ||
| """ |
There was a problem hiding this comment.
I still think this is a bit weird. I won't revert it though but I would like to keep the option to reconsider later...
|
The tests are now green and I'm very happy with the API overall. There are three things I want us to follow up on:
I don't think these issues should hold up this PR any longer as any PR adding a major new feature is going to need tweaks. I am happy to merge now so we can get testing and improving our new graph support! |
|
This pull request has been automatically locked since there has not been any recent activity after it was closed. Please open a new issue for related bugs. |
Based on the discussion @jlstevens and I had during SciPy sprints this PR adds a Graph Element to HoloViews. The outline below represents the discussion surrounding the API we had:
Terminology
Graph: Element that may or may not visualize itself.
Nodes: Element associating indices to positions and other information. Self-visualizing.
NodePaths: dataframe of connectivity information. Self-visualizing.
Graph - Composite Element
data: start and end columns (where start and end are the node indices)
kdims: [start, end]
vdims: [edge label and other metadata]
Nodes
Defines concrete position of each node using three columns/kdims, x/y position plus node index/label. Any value dimensions will be exposed as hover labels.
data: x,y positions + node index + anything else
kdims: [x, y, index]
vdims: [anything else (used as hover labels)]
NodePaths
Subclass of
Pathusing multi-interface representing the concrete pathsdata: [ dfs/array, ... ]
kdims: [x, y]
df/array: [xs,ys] Defines the path for each edge defined in abstract Graph
Graph Constructors
Graph(edges) - Abstract graph (cannot be displayed).
Graph((edges, nodes)) - Defines concrete node positions
Graph((edges, nodes, nodepaths)) - Define concrete node positions and concrete paths for edges connecting paths
Graph attributes
ToDo