Skip to content
New issue

Have a question about this project? Sign up for a free GitHub account to open an issue and contact its maintainers and the community.

By clicking “Sign up for GitHub”, you agree to our terms of service and privacy statement. We’ll occasionally send you account related emails.

Already on GitHub? Sign in to your account

[Spike] Autoscaled AKS Prometheus monitoring #1607

Closed
mkyc opened this issue Sep 2, 2020 · 3 comments
Closed

[Spike] Autoscaled AKS Prometheus monitoring #1607

mkyc opened this issue Sep 2, 2020 · 3 comments

Comments

@mkyc
Copy link
Contributor

mkyc commented Sep 2, 2020

Is your feature request related to a problem?
We need to check how to monitor scalable AKS cluster with prometheus. We already have prometheus in epiphany but it is implemented as a system service and the solution won't work in AKS autoscaling.

Describe the solution you'd like:
We would like to monitor our nodes/pods metrics in external/epiphany prometheus server.

Describe alternatives you've considered:

  • Monitor Nodes and also Pods?
  • Node Exporter as DaemonSets?
  • Prometheus federation using prometheus collector in order to scrap metrics inside of aks cluster and expose the collector for Prometheus server?
  • Prometheus operator?

Additional context:
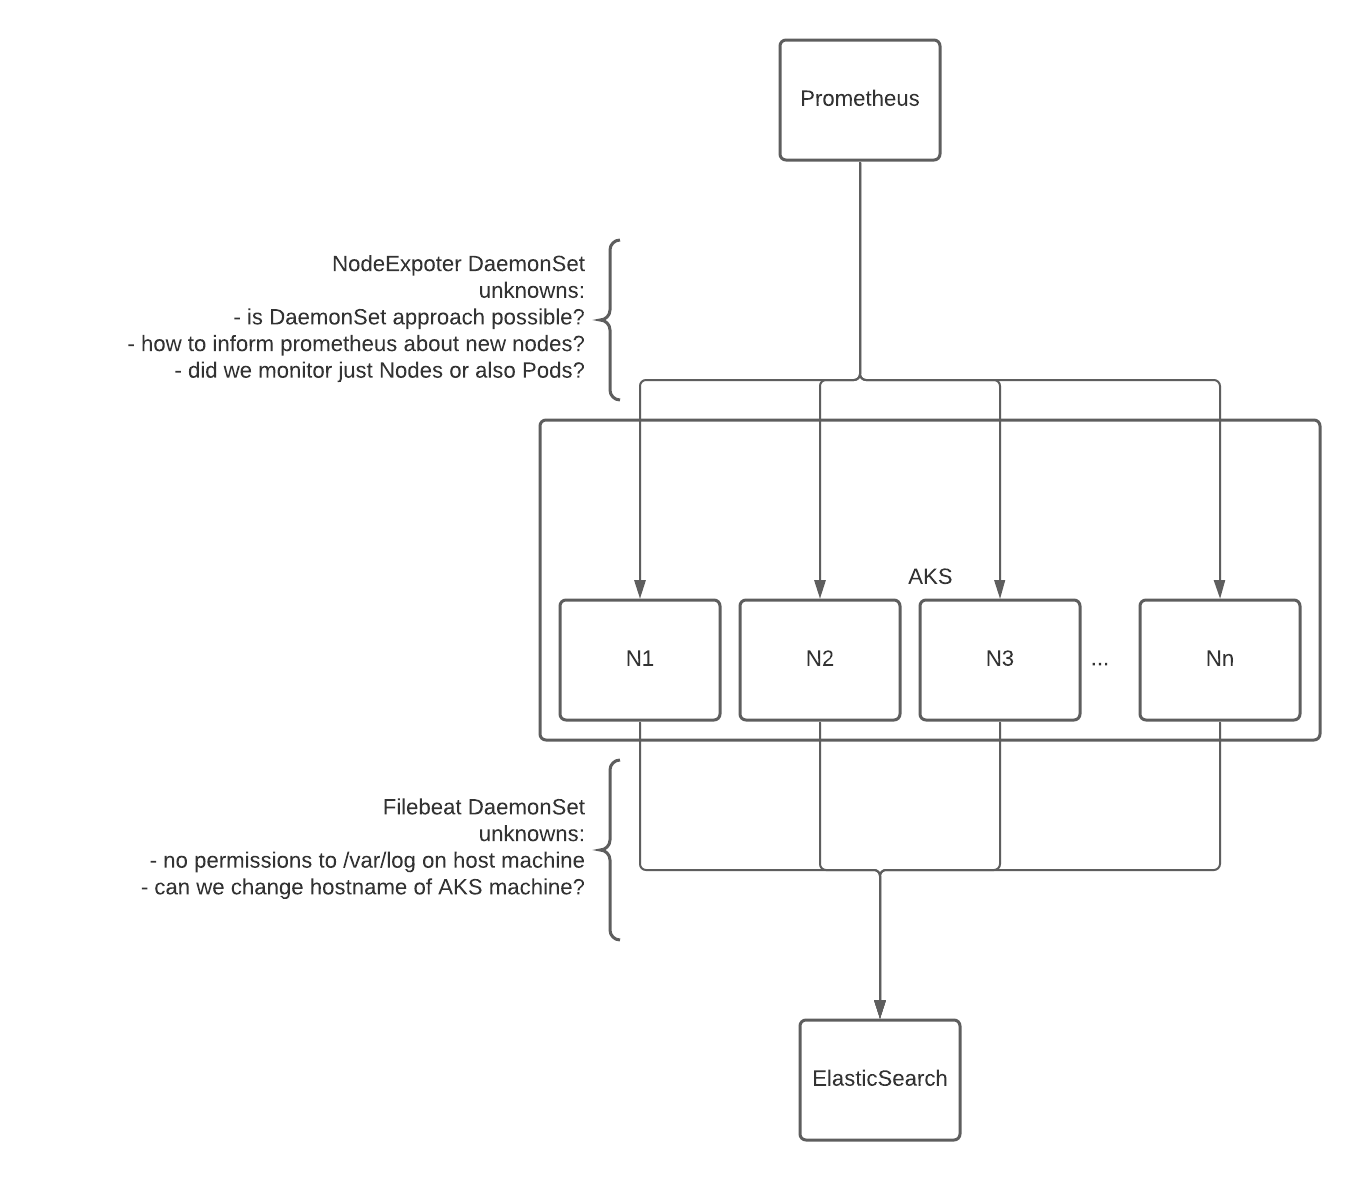
Upper section of following drawing might be helpful:
AKS-observability.png
Related to #1444

@rpudlowski93
Copy link
Contributor

rpudlowski93 commented Sep 2, 2020

Small update:

  • It is possible to run Node Exporters as DaemonSets what is nice for autoscaling in our case. It looks easy do to it using Helm: https://hub.helm.sh/charts/bitnami/node-exporter what is recommended. As We already know, we don't have access to master node in AKS so we have to run helm locally, the same as kubectl. We have to add the helm and kubectl to our devcontainer.

It is possible and I already tested it to deploy Node Exporter as DaemonSets manually using kubectl and manifests file from: https://github.com/prometheus-operator/kube-prometheus/tree/master/manifests, but in my opinion still better is to do it with helm.

@rpudlowski93
Copy link
Contributor

rpudlowski93 commented Sep 4, 2020

Regarding to unknowns in prometheus section:

  • DaemonSets of Node Exporter is possible. The best option is to use helm chart for that - it will be possible if the task will be done [FEATURE REQUEST] Add kubectl and Helm to epicli and devcontainer images #1618
  • How to inform prometheus about new nodes? By default prometheus works as pull style monitoring so it could be problematic in case of autoscaling in AKS when new nodes appear, but we can configure prometheus server with kubernetes_sd_config - Kubernetes Service Discovery . It is enough to deploy on worker nodes node exporter as daemon sets and configure prometheus with kubernetes_sd_config and endpoints. I checked and it looks that Kubernetes Service Discovery is already implemented in prometheus configuration in epiphany.
  • We can monitor in the same way nodes and pods too. (pods, nodes, endpoints, services...)
  • A single Prometheus server can easily handle millions of time series. That's enough for a thousand servers with a thousand time series each scraped every 10 seconds. As systems scale beyond that, there could be a problem and we should consider implement federations, but in my case it could be a feature for future, and we should know how the clusters is going to be.
  • We can't totally change hostname of AKS nodes. We can setup our custom "prefix" in the full hostname, for example in hostname aks-linux-24481073-vmss we can only change the "linux" part.

@mkyc mkyc modified the milestones: S20200910, S20200924 Sep 10, 2020
@mkyc
Copy link
Contributor Author

mkyc commented Sep 14, 2020

All clear for me. Moving it to DoD Check.

Sign up for free to join this conversation on GitHub. Already have an account? Sign in to comment
Projects
None yet
Development

No branches or pull requests

2 participants