% Data Science
Show & Tell
% Enrico Spinielli
% June 9, 2016
{data-background-image="images/mindmap.jpg" data-background-size="1100px" data-background-position="bottom"}
- life is short
- I am lazy
- You should not lie
- Humans are intelligent (w/ caveats ;-)
- ... and not all of them are working at Eurocontrol
- I'll (procastinate on boring stuff and only) work on useful/fun projects
- Automation saves me from repeating boring and/or forgotten tasks
- I'll be open to let others critisize/scrutinize/learn
- ...and I'll learn back from them
- I'll strive to produce truthful explanations/visualizations
The Axioms (IMHO) {data-background-image="images/mindmap.jpg" data-background-size="600px" data-background-position="bottom"}
- Value of data --> visualization
- Visualization --> WWW
- Make data available
- Generate a (static) website for the PRU
- Version control it all
- Automate!
Now
one year and a half later {data-background-image="images/website-home.png" data-background-size="850px" data-background-position="bottom"}
...still Metadata {data-background-image="images/website-metadata3.png" data-background-size="900px"}
- easy, i.e. textual (ASCII, no HTML): separate content from style
- nice Math (via MathJax):
$$f(x)=\sum_{n=0}^\infty\frac{f^{(n)}(a)}{n!}(x-a)^n$$ - bibliography: cite and style
- templates for different kind of pages (Definitions, list of ANSP's, RN's)
No need to edit in HTML: we (mainly) use Markdown (from Pandoc)
## Methodology

[Horizontal en-route flight efficiency methodology](/r/m/hfe_pi.html)
is fully consistent with the Single European Sky (SES)
Performance Scheme [see {% cite pru-hfe-pi --file aviation %}].

## Column naming and types

### HFE data

{:.metatable}
| Column name | Src | Label     | Column description    | Example |
|-------------|-----|-----------|-----------------------|---------|
| YEAR        | NM  | YEAR      | Reference year        | 2014    |
| MONTH_NUM   | NM  | MONTH_NUM | Month (numeric)       | 9       |
| MONTH_MON   | NM  | MONTH_MON | Month (3-letter code) | JAN     |
[//c]: {height=700px width="auto"}
Git ![]() {height=100px width="auto"} and GitHub
{height=100px width="auto"} and GitHub  {height=100px width="auto"}
 {height=700px width="auto"}
naming convention (GitHub Pages) <user>.github.io
 {height=700px width="auto"}
 {height=700px width="auto"}
Branching scheme (using Git)
 {height=700px width="auto"}
Pull Request from GitHub
 {height=700px width="auto"}
Issues from GitHub
 {height=700px width="auto"}
- from DB queries to website: scripts
- Jekyll: MD -> HTML
- Pandoc: MD -> PDF
- some from Rmarkdown/[knitr] in the near future
Automatic builds and deployment using TravisCI{target="_blank"}
 {height=700px width="auto"}
the site (running locally){target="_blank"}
the official PRU site, http://ansperformance.eu{target="_blank"}
DB {data-background-image="images/mindmap.jpg" data-background-size="600px" data-background-position="bottom"}
- new schema for production: PRUPROD
- use current ones for development (PRUDEV) and testing (PRUTEST)
- version control [PL]SQL code, i.e. which code was used to produc which indicators
- version control the DB used for prod: regulatory repository
- improved the Meta part of it: definitions, methodology
- add more data and (web) API (see ICAO iSTARS)
- generate the spreadsheets if CSV files/API are not enough
- PRR live in the website and PDF generated from the source in git repo
- add Jypiter notebooks to the website for case studies
We want you! {.slide: data-background="images/we-want-you.png" data-background-transition="zoom" data-state="wewantyou"}
- Share knowledge (or lack of)
- Learn from and know each other
- Discover internal and external datasets
- critisize & propose alternatives
- signal things you saw and would like to see implemented in our site
For example NYT, Bloomberg (1, 2), WP, ProPublica, The Guardian, Financial Times ... have fantastic infographics
- emails with questions, proposals are a good start
- you are always welcome to come and chat (but bring your coffee)
- present at the next Show & Tell
- D3.js: Mike Bostock, Ian Johnson, Elijah Meeks, Nadieh Bremer, Susie Lu, Christophe Viau
- Viz gurus: Alberto Cairo, Stephen Few, Edward Tufte, Enrico Bertini, Maarten Lambrechts, Jonathan Corum, Jeffrey Heer ...
- Twitter: big inspiration from
#d3js#dataviz - Statistics: Hadley Wickham
- Conferences: Eyeo Festival, OpenVis Conference
- Awards: Malofiej, Data Journalism Awards
- Newspapers: NYT, The Guardian, Bloomberg, The Washington Post, Pro Publica, National Public Radio ...
Yes, you still have to study!
- Tufte, Edward
- Cairo, Alberto
- Few, Stephen
- PRU animated logo inspired by UW Interactive Data Lab
- Thank You cloud generated w/ Jason Davies' Word Cloud generator
- Search Engine functionality from DuckDuckGo API
- Flight Flows inspired by Global Flow of People and made possible by adapting Vienna Institute of Demography shared source code
- STATFOR's experiment inspired by Amanda Cox's NYT article via Vega Editor example
xkdc 1319 and explanation
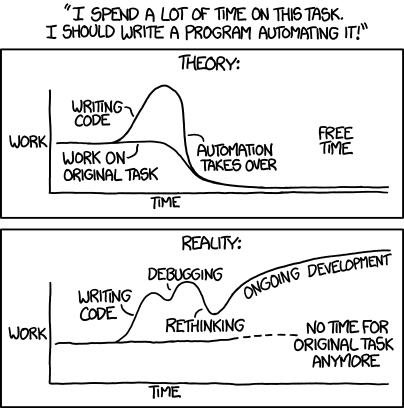
Title text: 'Automating' comes from the roots 'auto-' meaning 'self-', and 'mating', meaning 'screwing'.
xkdc 1205 and explanation
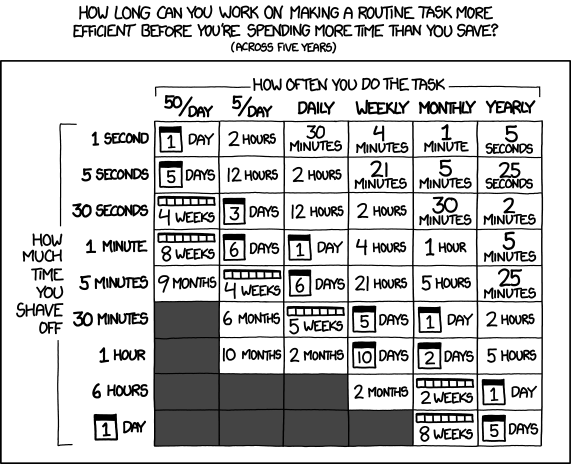
Title text: Don't forget the time you spend finding the chart to look up what you save. And the time spent reading this reminder about the time spent. And the time trying to figure out if either of those actually make sense. Remember, every second counts toward your life total, includingthese right now.
xkdc 1205 and explanation

Title text: Correlation doesn't imply causation, but it does waggle its eyebrows suggestively and gesture furtively while mouthing 'look over there'.
 {height=400px width="auto"}
 {height=400px width="auto"}
xkdc 833 and explanation

Title text: Don't forget the time you spend finding the chart to look up what you save. And the time spent reading this reminder about the time spent. And the time trying to figure out if either of those actually make sense. Remember, every second counts toward your life total, includingthese right now.