forked from yonghah/esri2sf
-
Notifications
You must be signed in to change notification settings - Fork 0
/
Copy pathREADME.Rmd
219 lines (144 loc) · 10.6 KB
/
README.Rmd
1
2
3
4
5
6
7
8
9
10
11
12
13
14
15
16
17
18
19
20
21
22
23
24
25
26
27
28
29
30
31
32
33
34
35
36
37
38
39
40
41
42
43
44
45
46
47
48
49
50
51
52
53
54
55
56
57
58
59
60
61
62
63
64
65
66
67
68
69
70
71
72
73
74
75
76
77
78
79
80
81
82
83
84
85
86
87
88
89
90
91
92
93
94
95
96
97
98
99
100
101
102
103
104
105
106
107
108
109
110
111
112
113
114
115
116
117
118
119
120
121
122
123
124
125
126
127
128
129
130
131
132
133
134
135
136
137
138
139
140
141
142
143
144
145
146
147
148
149
150
151
152
153
154
155
156
157
158
159
160
161
162
163
164
165
166
167
168
169
170
171
172
173
174
175
176
177
178
179
180
181
182
183
184
185
186
187
188
189
190
191
192
193
194
195
196
197
198
199
200
201
202
203
204
205
206
207
208
209
210
211
212
213
214
215
216
217
218
219
---
output: github_document
---
<!-- README.md is generated from README.Rmd. Please edit that file -->
```{r, include = FALSE}
knitr::opts_chunk$set(
collapse = TRUE,
comment = "#>",
fig.path = "man/figures/README-",
out.width = "100%"
)
```
# esri2sf
<!-- badges: start -->
[](https://CRAN.R-project.org/package=esri2sf)
[](https://www.repostatus.org/#active)
[](https://opensource.org/licenses/MIT)
<!-- badges: end -->
Download ArcGIS FeatureServer and MapServer Data to Simple Features
**Note:** This package has diverged substantially from the [original esri2sf package](https://github.com/yonghah/esri2sf/) and I am unsure when or if any of the code may be merged back into the original repository. I am actively maintaining this package so please feel free to submit an issue if you have any feature requests or problems.
The [ArcGIS FeatureServer](https://enterprise.arcgis.com/en/server/latest/publish-services/windows/what-is-a-feature-service-.htm) or [MapServer](https://enterprise.arcgis.com/en/server/latest/publish-services/windows/what-is-a-map-service.htm) services are among the most common sources for geospatial data. The esri2sf package enables users to download data from an ArcGIS Server to a simple feature (sf) or data frame object using the [ArcGIS REST API](https://developers.arcgis.com/rest/). You can learn more about [working with sf objects](https://r-spatial.github.io/sf/articles/sf1.html) in the documentation for the [sf package](https://r-spatial.github.io/sf/).
## How esri2sf works
This package takes the layer URL and query (created from a bounding box, geometry, and other parameters). Typically, the ArcGIS REST API limits the maximum number of rows that can be returned from a single query. This package uses [httr2](https://httr2.r-lib.org/) to query the server and initially returns the ID for all features and then batches the IDs to return all requested features from the server.
The geometry is returned as a [FeatureSet object](https://developers.arcgis.com/documentation/common-data-types/featureset-object.htm) (also known as an ESRI JSON object). The JSON is converted into an sf object and combined with the attribute data to return an sf data frame.
## Install
Use [pak](https://pak.r-lib.org/) to install this fork of the esri2sf package from GitHub:
``` r
pak::pkg_install("elipousson/esri2sf")
```
## How to use esri2sf
To use esri2sf, you need is the URL of a FeatureServer or MapServer layer you want to download. You can get the URL by viewing the URL widget on the service's webpage (see image below), by asking a GIS admin, or looking at the code of a webpage where it creates a feature layer.

You can then use the url with esri2sf to download data:
```{r points}
library(esri2sf)
url <- "https://services.arcgis.com/V6ZHFr6zdgNZuVG0/arcgis/rest/services/Landscape_Trees/FeatureServer/0"
df <- esri2sf(url)
plot(df)
```
<!--  -->
### Select fields using `outFields`
You can select specific output fields. You can check the names of the data source columns using the `esrimeta()` function with `fields = TRUE`. Set `progress = TRUE` to show a progress bar for larger downloads (such as this 18000 polyline data).
```{r polyline}
url <- "https://services.arcgis.com/V6ZHFr6zdgNZuVG0/arcgis/rest/services/Florida_Annual_Average_Daily_Traffic/FeatureServer/0"
esrimeta(url, fields = TRUE)
df <- esri2sf(url, outFields = c("AADT", "DFLG"))
plot(df)
```
<!-- 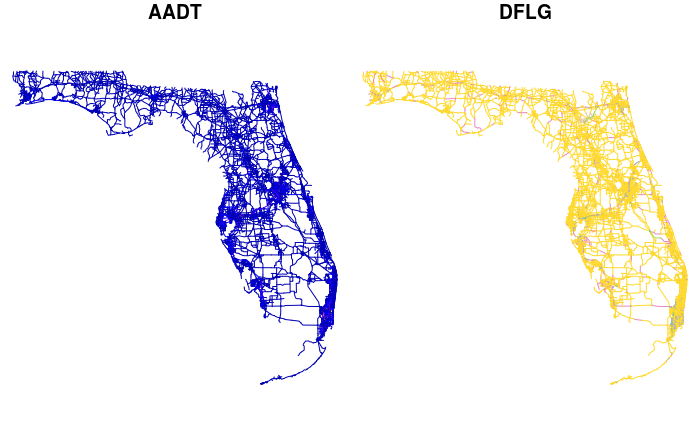 -->
### Filter rows using `where`
You can filter rows as well by providing a `where` condition in standardized SQL (SQL-92) that is applied to non-spatial attributes. See[ the ArcGIS documentation](https://enterprise.arcgis.com/en/portal/latest/use/calculate-fields.htm#ESRI_SECTION1_28F344E2E80C410A98D443FF301DF989) for more information on supported operators and functions.
```{r polygon}
url <- "https://sampleserver6.arcgisonline.com/arcgis/rest/services/Census/MapServer/2"
mi <- esri2sf(
url,
where = "STATE_NAME = 'Michigan'",
outFields = c("POP2000", "pop2007", "POP00_SQMI", "POP07_SQMI")
)
plot(mi)
```
<!--  -->
### Use `esri2df()` to download tabular data
You can download non-spatial tables of the 'Table' layer type using `esri2df()`.
```{r tables}
df <- esri2df("https://sampleserver6.arcgisonline.com/arcgis/rest/services/SF311/MapServer/1", where = "category = 'VEHICLE THEFT'")
df
```
In some cases, tables may include coordinates as numeric attribute columns but no geometry. If this is the case, you can create a bounding box filter condition using the `glue_sql_bbox()` helper function:
```{r}
# Using the Michigan sf data to create a bbox
bbox <- sf::st_bbox(mi)
coords <- c("longitude", "latitude")
glue_sql_bbox(bbox, coords)
```
### Using the `crs` parameter
When specifying the CRS parameter, any transformation that happens will be done within the ArcGIS REST API. Caution should be taken when specifying an output `crs` that requires a datum transformation as ESRI will automatically apply a default transformation (with no feedback as to which one) which could end up adding small unexpected errors into your data.
By default, `esri2sf()` will transform any data to WGS 1984 (EPSG:4326), but it may be safer to set `crs = NULL` which will return the data in the same CRS as the host service. You can also set an alternate default crs using `options`, e.g. `options("esri2sf.crs", 3857)`.
```{r}
url <- "https://sampleserver6.arcgisonline.com/arcgis/rest/services/Census/MapServer/2"
where <- "STATE_NAME = 'Michigan'"
outFields <- c("POP2000", "pop2007", "POP00_SQMI", "POP07_SQMI")
# default crs = 4326
esri2sf(url, where = where, outFields = outFields)
# No transformation (recommended)
esri2sf(url, where = where, outFields = outFields, crs = NULL)
```
The `glue_ansi_sql()` helper is useful when building queries with vectors of possible values:
```{r}
states <- c("Alabama", "Michigan")
where <- glue_ansi_sql("STATE_NAME", " IN ({states*})")
esri2sf(url, where = where, outFields = c("STATE_NAME", outFields))
```
Since the addition of the `WKT1_ESRI` output from `sf::st_crs()` in sf version 1.0-1, you can enter common CRS format (any that `sf::st_crs()` can handle) into the `crs` parameters and it will be able to convert to the ESRI formatted WKT needed for the outSR field in the REST query.
Below are two examples of the variety of input types that you can use with the `crs` parameters.
```{r}
# ESRI Authority Code
df1 <- esri2sf(url, where = where, outFields = outFields, crs = "ESRI:102690")
# OGC WKT
df2 <- esri2sf(url, where = where, outFields = outFields, crs = 'PROJCS["NAD_1983_StatePlane_Michigan_South_FIPS_2113_Feet",GEOGCS["GCS_North_American_1983",DATUM["North_American_Datum_1983",SPHEROID["GRS_1980",6378137,298.257222101]],PRIMEM["Greenwich",0],UNIT["Degree",0.017453292519943295]],PROJECTION["Lambert_Conformal_Conic_2SP"],PARAMETER["False_Easting",13123333.33333333],PARAMETER["False_Northing",0],PARAMETER["Central_Meridian",-84.36666666666666],PARAMETER["Standard_Parallel_1",42.1],PARAMETER["Standard_Parallel_2",43.66666666666666],PARAMETER["Latitude_Of_Origin",41.5],UNIT["Foot_US",0.30480060960121924],AUTHORITY["EPSG","102690"]]')
```
Their similarity on the output CRS can be proven by the following function that calculates the mean difference in X-Y coordinates at each point. All are very close to 0.
```{r}
coord_diff <- function(df1, df2) {
suppressWarnings({
c(
"x" = mean(sf::st_coordinates(sf::st_cast(df1, "POINT"))[, 1] - sf::st_coordinates(sf::st_cast(df2, "POINT"))[, 1]),
"y" = mean(sf::st_coordinates(sf::st_cast(df1, "POINT"))[, 2] - sf::st_coordinates(sf::st_cast(df2, "POINT"))[, 2])
)
})
}
coord_diff(df1, df2)
```
### Additional functions
The `esriRequest()` function has also made it easier to build new functions for ArcGIS REST API services. `esriCatalog()` uses the [Catalog endpoint](https://developers.arcgis.com/rest/services-reference/enterprise/catalog.htm) to return a list of folders and layers.
```{r}
url <- "https://sampleserver6.arcgisonline.com/ArcGIS/rest/services"
esriCatalog(url)[1:5]
```
`esriIndex()` wraps `esriCatalog()` but returns a data frame with added columns to differentiate between folder, service, and layer URLs.
```{r}
esriIndex(url)
```
Set `recurse = TRUE` to loop through folders and ensure the data frame includes all available services.
```{r, eval=FALSE}
esriIndex(url, recurse = TRUE)
```
Similarly, the new `esrigeocode()` provides support for the [Find Address Candidates](https://developers.arcgis.com/rest/services-reference/enterprise/find-address-candidates.htm) and [Reverse Geocode](https://developers.arcgis.com/rest/services-reference/enterprise/reverse-geocode.htm) REST APIs.
```{r}
url <- "https://geodata.baltimorecity.gov/egis/rest/services/Locator/EGISCompositeLocator/GeocodeServer"
esrigeocode(url, address = "100 HOLLIDAY STREET")
```
## Related projects
### R packages
- [{arcgisbinding}](https://github.com/R-ArcGIS/r-bridge) and the [R-ArcGIS Bridge](https://www.esri.com/en-us/arcgis/products/r-arcgis-bridge/overview)
- [{arcpullr}](https://github.com/pfrater/arcpullr/): Functions for pulling spatial data from an ArcGIS REST API and formatting those layers into either sf or Raster* objects.
- [{geosapi}](https://github.com/eblondel/geosapi): GeoServer REST API R Interface
- [{aarapir}](https://github.com/mps9506/aarapir): Access ArcGIS online API endpoints with R
- [{RPyGeo}](https://github.com/r-spatial/RPyGeo)
### Other
- [esri-dump](https://github.com/openaddresses/esri-dump): A Node module to assist with pulling data out of an ESRI ArcGIS REST server into GeoJSON.
- [pyesridump](https://github.com/openaddresses/pyesridump): Scrapes an ESRI MapServer REST endpoint to spit out more generally-usable geodata.
- [Geocoding Addresses with the ArcGIS REST API (Stanford Affiliates Only)](https://github.com/cengel/ArcGIS_geocoding)
- [All things R Spatial](https://arc2r.github.io/book/): An introduction to spatial R for ArcGIS users ([repo](https://github.com/arc2r/book))
- [ArcRasterRescue](https://github.com/r-barnes/ArcRasterRescue): Extract raster data from ArcGIS/ESRI formats.