This extension adds trace viewing capabilities to VSCode and compatible tools. It requires running a trace server, that provides trace information. See below for more details.
For information about building this extension from sources, debugging, etc, please see here (README.md)
Open the Trace Viewer view (View -> Open view...).
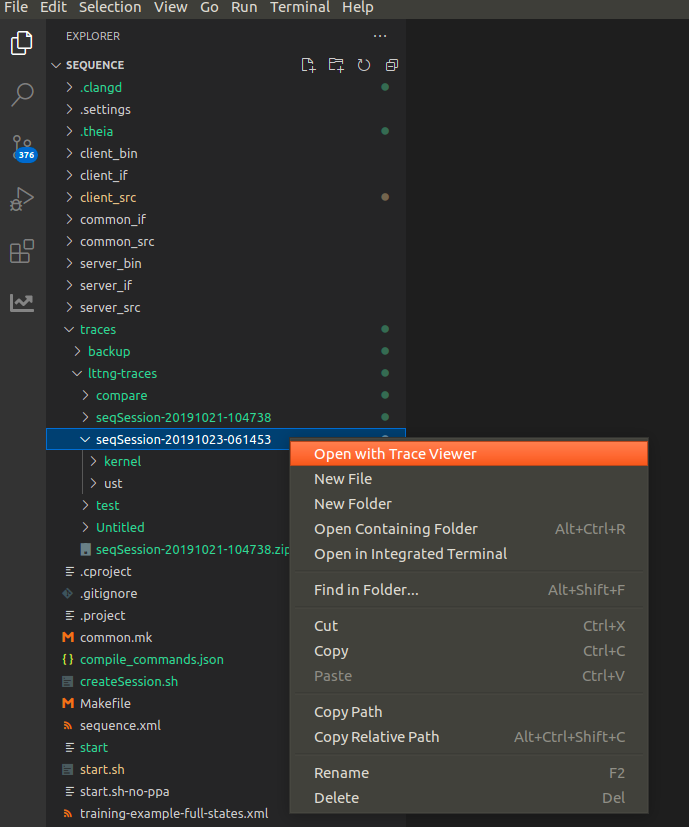
Then find the trace folder in the file explorer and open it using Open with Trace Viewer from the context menu:
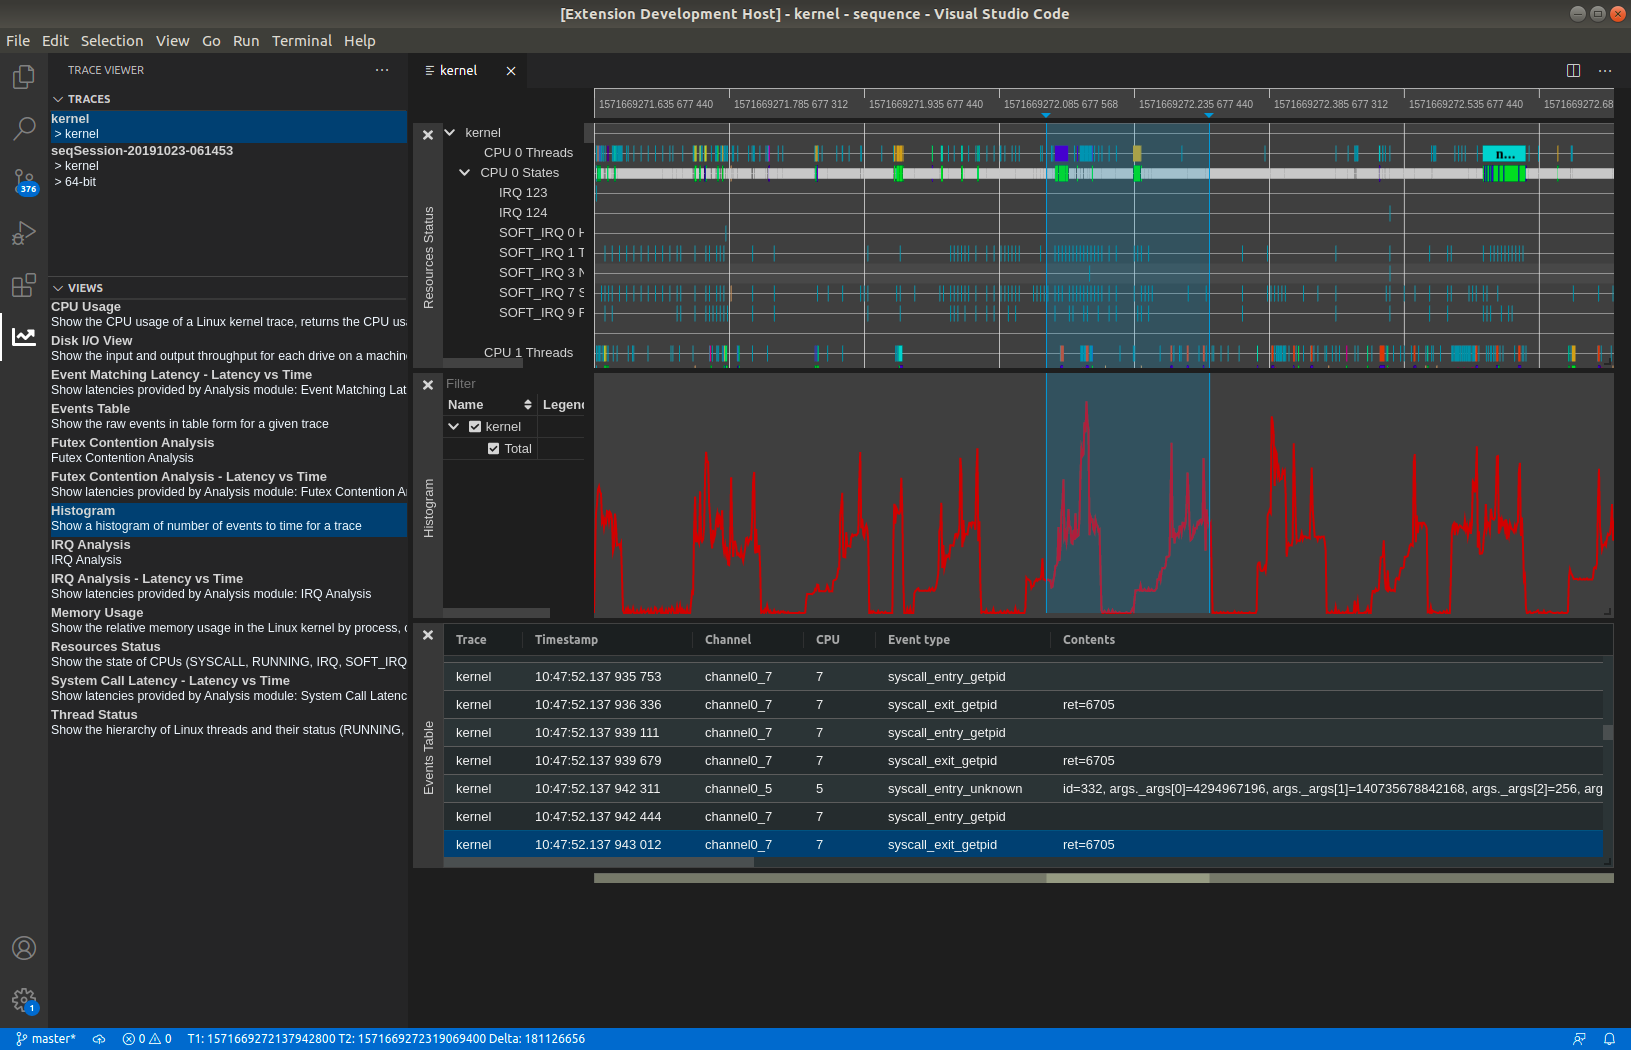
Two tabs will be visible: Traces and Views. The Traces tab will show all available traces on the trace server.
The Views tab shows all the available views for the selected trace. Click on a view to open the view under the timeline.
In order to open and view traces, you need a trace server, that supports TSP (Trace Server Protocol), running on the same machine as this extension. You can use the Eclipse Trace Compass server:
Download the Latest "incubator" build:
Extract it. e.g.:
tar -xf trace-compass-server-latest-linux.gtk.x86_64.tar.gz
and start it. e.g.:
./trace-compass-server-latest-linux.gtk.x86_64/tracecompass-server"
Note: a single trace server can serve multiple traces / clients
For information about using the extension with remote-ssh, please see Remote SSH Support for the Trace Viewer for VSCode extension.

