There are various types of distributions in NetLogo:
random-poisson mean
random-normal average stdev
random-exponential average
random-gamma alpha lambda
with alpha equal to average * average / variance and lambda equal to 1 / (variance / average)
If we run the model for 10,000 ticks and draw a random number from each distribution we get the following distributions.
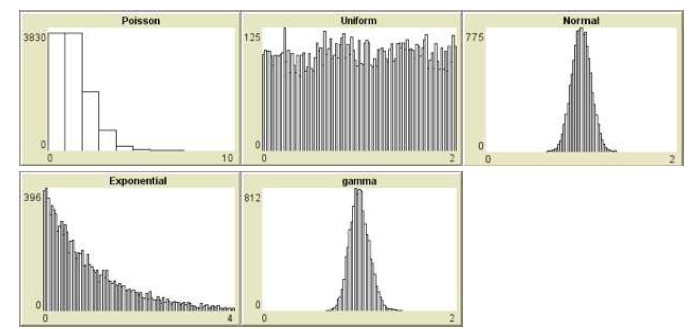
Figure 11
The average of the distributions converge to 1 as seen in the Figure 12 below. It takes a few hunderd observations before the mean becomes close to one. This shows that it is important to have many observations to do models with random numbers. Each run is different and to have an informed decision on the results of the model, you have to run the model many times. Luckily NetLogo has a tool that makes it convenient to run a model many times and store the results in text files for further analysis. We discuss this in the next section.
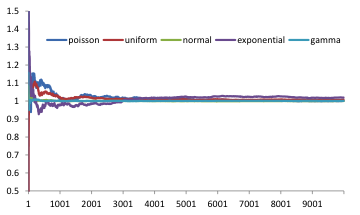
Figure 12. The mean of observations of 5 distributions. On the y axis is the number of observations generated.
NETLOGO EXAMPLE: RANDOM DISTRIBUTIONS VARIATIONS
Model: Right click on the Link and Save it. Open Netlogo and Run it with NetLogo.