We will present a simple model in which agents make decisions on which product to buy from a set of N possible products. Agents are connected to each other in a social-network. Agents buy products according to the decision rules and evaluate their choices relative to what happens in the neighborhood of their social network.
The utility of using a product consists of an individual part and a social effect part. The individual part expresses the degree of fit between the product characteristics and the preferences of the consumer. In the model this individual utility is expressed as the difference between the single personal preference of a consumer and the single product characteristic. The personal preference of actor i, pi, is expressed by a value between 0 and 1. The utility of the product, based on personal preferences alone, is equal to one minus the absolute difference between personal preference pi and product dimension δj. Hence the smaller the difference between the individual preference and the product characteristic, the closer the individual utility gets to its maximum value of 1.
The social effect means that the utility of a product increases when more friends consume the same product. This effect only affects the social need satisfaction. Hence, this effect qualitatively differs from the positive network effect often discussed in markets such as software, fax machines and the like, because the individual utility is not affected by the number of friends consuming the same product. This social effect relates to the need to conform to others in the agent’s network. The variable xj denotes therefore average distance of choices made by the agents and their neighbors. For each agent we calculate the ratio of products as a fraction of all products consumed among the neighbors of the agent. The total expected utility of consuming product j is equal to:
 (1)
(1)
The components of the utility function, the individual part and the social part, are weighted with βi and 1-βi, with βi ∈ [0,1]. A low βi holds that personal need is weighted less, as is usually the case with less innovative people (Rogers, 1995), whereas a high βi holds that social needs are weighted less, as is usually the case with more innovative people. The dimension δj on which the agents make decisions can represent various product characteristics.
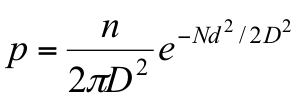
The agents are located in a network. Like the previous chapter we first place agents randomly on the landscape, but instead of connecting nodes to nearest other nodes, we link agents to both nearby and faraway agents. The probability of any two agents being connected to each other is calculated so that the probability of a connection between any two agents decreases as the spatial distance between them increases. The probability that a short-length connection will be made rather than a long-distance connection is determined by a parameter, D, which represents the desired link length in the network.
Given two agents separated by distance d, the probability of a link connecting them is:
 (2)
(2)
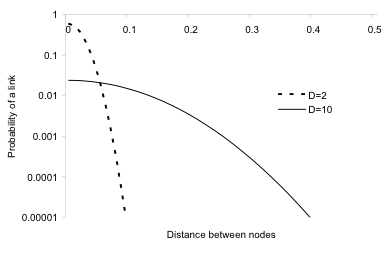
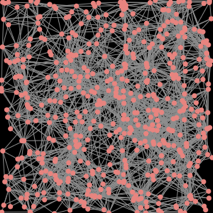
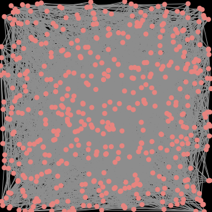
where n is the average number of links in the network, d is the average network density, D is the desired length-scale for generating networks, and N the number of agents. When D is small, i.e., D = 2, agents will be preferentially connected to agents within their immediate spatial vicinity. When D is larger, i.e., D = 10, agents are more connected with individuals at greater distances from themselves, that is, they are more “globally” connected (Figures 2 and 3).
*
Figure 2: The effect of D on the network structure. With D=2 the connections are more local compared to D=10.*
*
Figure 3. Network of 500 agents using D= 2 (top) and D = 10 (bottom).*
Agents make a decision to buy a product with probability pb (=0.10). When an agent makes a decision it will continue the choice of past rounds if the experienced utility is higher than the minimum utility that satisfies the agent umin. If the agent is not satisfied, the agent will calculate the expected utility for all N products and chooses the one which will maximizes her utility. Since agents will use less cognitive energy if they repeat decisions from the past, it is common to repeat past decisions if you have been happy with the outcome. Only when it is needed will you evaluate all the options.
We now turn to some exercises. Let’s assume all agents have the same values for β and umin. We will vary β and umin and run the model 100 times for each parameter combination. All agents are initialized randomly with one of the available products.
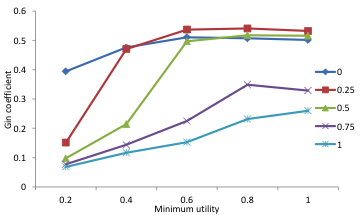
What do we measure from the simulations? We would like to know whether the products are distributed evenly among the agents, which would be the case if they only care about their own individual preferences. Therefore we calculate the gini coefficient of the products bought by the agents at the end of the simulation. Figure 4 shows that there is a low gini coefficient, equal spread of the products among agents, if agents weight the individual preferences high and when the minimum utility level is low. If β is 0.5 or higher the gini coefficient will rise to above 0.5 especially if the minimum utility is high. In such situations one or two products dominate the market. Agents value conformity and therefore buy similar products as their friends.
*
Figure 4.Gini coefficient of the distribution of products in the population for different parameter combinations. Results are averages for 100 runs of 100 ticks.*
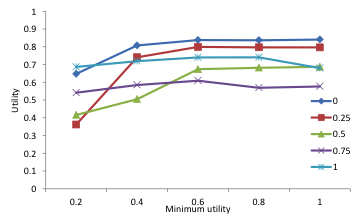
The other variable we measure is the average utility at the end of the simulation. In general higher utility is derived if the minimum utility is higher (Figure 5). The utility is also higher if they focus more on conformity. The reason for this is the relative small number of choices, 10 products, and the uniform spread of the preferences. Products cannot fully satisfy individual preferences, but if people weigh social preferences more they can get a high utility by buying the same products as their friends do.
*
Figure 5. Average utility for different parameter combinations.*
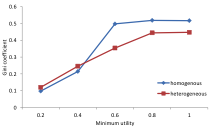
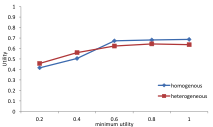
In the previous simulations the β value of all agents was equal to 0.5. What would be the consequence of agents having different values of β? It would mean that some agents are innovators, focusing on products meeting their preferences, while others are behind in adopting new products but care to conform with the majority in their circle of friends. We see that a heterogeneous distribution of β leads to a lower gini coefficient and lower utility if the threshold of the minimum level of utility is high. As we see in Figure 4 a high β leads to lower gini coefficient and variation of β follows this trend.
*
Figure 6. The gini coefficient (top) and average utility (bottom) for different parameter values and where β was 0.5 or on average 0.5 but with a uniform distribution between 0 and 1.*
NETLOGO EXAMPLE: CONSUMERS IN
Model: Right click on the Link and Save it. Open Netlogo and Run it with NetLogo.