By default, controller-runtime builds a global prometheus registry and publishes a collection of performance metrics for each controller.
Images provided under gcr.io/kubebuilder/ will be unavailable from March 18, 2025.
-
Projects initialized with Kubebuilder versions
v3.14or lower utilize kube-rbac-proxy to protect the metrics endpoint. Therefore, you might want to continue using kube-rbac-proxy by simply replacing the image or changing how the metrics endpoint is protected in your project. -
However, projects initialized with Kubebuilder versions
v4.1.0or higher have a similar protection using authn/authz enabled by default via Controller-Runtime's feature WithAuthenticationAndAuthorization. In this case, you might want to upgrade your project or simply ensure that you have applied the same code changes to it.
Please ensure that you update your configurations accordingly to avoid any disruptions.
Kubebuilder has been rebuilding and re-tagging these images for several years. However, due to recent infrastructure changes for projects under the Kubernetes umbrella, we now require the use of shared infrastructure. But as kube-rbac-proxy is in a process to be a part of it, but not yet, sadly we cannot build and promote these images using the new k8s infrastructure. To follow up the ongoing process and changes required for the project be accepted by, see: brancz/kube-rbac-proxy#238
Moreover, Google Cloud Platform has deprecated the Container Registry, which has been used to promote these images.
Additionally, ongoing changes and the phase-out of the previous GCP infrastructure mean that Kubebuilder maintainers are no longer able to support, build, or ensure the promotion of these images. For further information, please check the proposal for this change and its motivations here.
- (Protection enabled by default from release
v4.1.0) By using Controller-Runtime's feature WithAuthenticationAndAuthorization which can handleauthn/authzsimilar what was provided viakube-rbac-proxy. - By using NetworkPolicies. (example)
- By integrating cert-manager with your metrics service you can secure the endpoint via TLS encryption
- (Not support or promoted by Kubebuilder) By still using kube-rbac-proxy and the image provided by the project (quay.io/brancz/kube-rbac-proxy) or from any other source
By looking at the file config/default/kustomization.yaml you can
check the metrics are exposed by default:
# [METRICS] Expose the controller manager metrics service.
- metrics_service.yamlpatches:
# [METRICS] The following patch will enable the metrics endpoint using HTTPS and the port :8443.
# More info: https://book.kubebuilder.io/reference/metrics
- path: manager_metrics_patch.yaml
target:
kind: DeploymentThen, you can check in the cmd/main.go where metrics server
is configured:
// Metrics endpoint is enabled in 'config/default/kustomization.yaml'. The Metrics options configure the server.
// For more info: https://pkg.go.dev/sigs.k8s.io/controller-runtime/pkg/metrics/server
Metrics: metricsserver.Options{
   ...
},Unprotected metrics endpoints can expose valuable data to unauthorized users, such as system performance, application behavior, and potentially confidential operational metrics. This exposure can lead to security vulnerabilities where an attacker could gain insights into the system's operation and exploit weaknesses.
To mitigate these risks, Kubebuilder projects utilize authentication (authn) and authorization (authz) to protect the metrics endpoint. This approach ensures that only authorized users and service accounts can access sensitive metrics data, enhancing the overall security of the system.
In the past, the kube-rbac-proxy was employed to provide this protection.
However, its usage has been discontinued in recent versions. Since the release of v4.1.0, projects have had the
metrics endpoint enabled and protected by default using the WithAuthenticationAndAuthorization
feature provided by controller-runtime.
Therefore, you will find the following configuration:
- In the
cmd/main.go:
if secureMetrics {
  ...
  metricsServerOptions.FilterProvider = filters.WithAuthenticationAndAuthorization
}
This configuration leverages the FilterProvider to enforce authentication and authorization on the metrics endpoint. By using this method, you ensure that the endpoint is accessible only to those with the appropriate permissions.
- In the
config/rbac/kustomization.yaml:
# The following RBAC configurations are used to protect
# the metrics endpoint with authn/authz. These configurations
# ensure that only authorized users and service accounts
# can access the metrics endpoint.
- metrics_auth_role.yaml
- metrics_auth_role_binding.yaml
- metrics_reader_role.yaml
In this way, only Pods using the ServiceAccount token are authorized to read the metrics endpoint. For example:
apiVersion: v1
kind: Pod
metadata:
  name: metrics-consumer
  namespace: system
spec:
  # Use the scaffolded service account name to allow authn/authz
  serviceAccountName: controller-manager
  containers:
  - name: metrics-consumer
    image: curlimages/curl:7.78.0
    command: ["/bin/sh"]
    args:
      - "-c"
      - >
        while true;
        do
          # Note here that we are passing the token obtained from the ServiceAccount to curl the metrics endpoint
          curl -s -k -H "Authorization: Bearer $(cat /var/run/secrets/kubernetes.io/serviceaccount/token)"
          https://controller-manager-metrics-service.system.svc.cluster.local:8443/metrics;
          sleep 60;
        done
The default scaffold to configure the metrics server in cmd/main.go uses TLSOpts that rely on self-signed certificates
(SelfCerts), which are generated automatically. However, self-signed certificates are not recommended for production
environments as they do not offer the same level of trust and security as certificates issued by a trusted
Certificate Authority (CA).
While self-signed certificates are convenient for development and testing, they are unsuitable for production because they do not establish a chain of trust, making them vulnerable to security threats.
Furthermore, check the configuration file located at config/prometheus/monitor.yaml to
ensure secure integration with Prometheus. If the insecureSkipVerify: true option is enabled,
it means that certificate verification is turned off. This is not recommended for production as
it poses a significant security risk by making the system vulnerable to man-in-the-middle attacks,
where an attacker could intercept and manipulate the communication between Prometheus and the monitored services.
This could lead to unauthorized access to metrics data, compromising the integrity and confidentiality of the information.
In both cases, the primary risk is potentially allowing unauthorized access to sensitive metrics data.
-
Replace Self-Signed Certificates:
- Instead of using
TLSOpts, configure theCertDir,CertName, andKeyNameoptions to use your own certificates. This ensures that your server communicates using trusted and secure certificates.
- Instead of using
-
Configure Prometheus Monitoring Securely:
-
Check and update your Prometheus configuration file (
config/prometheus/monitor.yaml) to ensure secure settings. -
Replace
insecureSkipVerify: truewith the following secure options:caFile: The path to the CA certificate file, e.g., /etc/metrics-certs/ca.crt. certFile: The path to the client certificate file, e.g., /etc/metrics-certs/tls.crt. keyFile: The path to the client key file, e.g., /etc/metrics-certs/tls.key.
These settings ensure encrypted and authenticated communication between Prometheus and the monitored services, providing a secure monitoring setup.
-
Some known limitations and considerations have been identified. The settings for cache TTL, anonymous access, and
timeouts are currently hardcoded, which may lead to performance and security concerns due to the inability to
fine-tune these parameters. Additionally, the current implementation lacks support for configurations like
alwaysAllow for critical paths (e.g., /healthz) and alwaysAllowGroups (e.g., system:masters), potentially
causing operational challenges. Furthermore, the system heavily relies on stable connectivity to the kube-apiserver,
making it vulnerable to metrics outages during network instability. This can result in the loss of crucial metrics data,
particularly during critical periods when monitoring and diagnosing issues in real-time is essential.
An issue has been opened to enhance the controller-runtime and address these considerations.
NetworkPolicy acts as a basic firewall for pods within a Kubernetes cluster, controlling traffic
flow at the IP address or port level. However, it doesn't handle authn/authz.
Uncomment the following line in the config/default/kustomization.yaml:
# [NETWORK POLICY] Protect the /metrics endpoint and Webhook Server with NetworkPolicy.
# Only Pod(s) running a namespace labeled with 'metrics: enabled' will be able to gather the metrics.
# Only CR(s) which uses webhooks and applied on namespaces labeled 'webhooks: enabled' will be able to work properly.
#- ../network-policy
Integrating cert-manager with your metrics service can secure the endpoint via TLS encryption.
To modify your project setup to expose metrics using HTTPS with
the help of cert-manager, you'll need to change the configuration of both
the Service under config/default/metrics_service.yaml and
the ServiceMonitor under config/prometheus/monitor.yaml to use a secure HTTPS port
and ensure the necessary certificate is applied.
Follow the steps below to export the metrics using the Prometheus Operator:
-
Install Prometheus and Prometheus Operator. We recommend using kube-prometheus in production if you don't have your own monitoring system. If you are just experimenting, you can only install Prometheus and Prometheus Operator.
-
Uncomment the line
- ../prometheusin theconfig/default/kustomization.yaml. It creates theServiceMonitorresource which enables exporting the metrics.
# [PROMETHEUS] To enable prometheus monitor, uncomment all sections with 'PROMETHEUS'.
- ../prometheus
Note that, when you install your project in the cluster, it will create the
ServiceMonitor to export the metrics. To check the ServiceMonitor,
run kubectl get ServiceMonitor -n <project>-system. See an example:
$ kubectl get ServiceMonitor -n monitor-system
NAME                                         AGE
monitor-controller-manager-metrics-monitor   2m8s
If you are using Prometheus Operator, be aware that, by default, its RBAC
rules are only enabled for the default and kube-system namespaces. See its
guide to know how to configure kube-prometheus to monitor other namespaces using the .jsonnet file.
Alternatively, you can give the Prometheus Operator permissions to monitor other namespaces using RBAC. See the Prometheus Operator
Enable RBAC rules for Prometheus pods
documentation to know how to enable the permissions on the namespace where the
ServiceMonitor and manager exist.
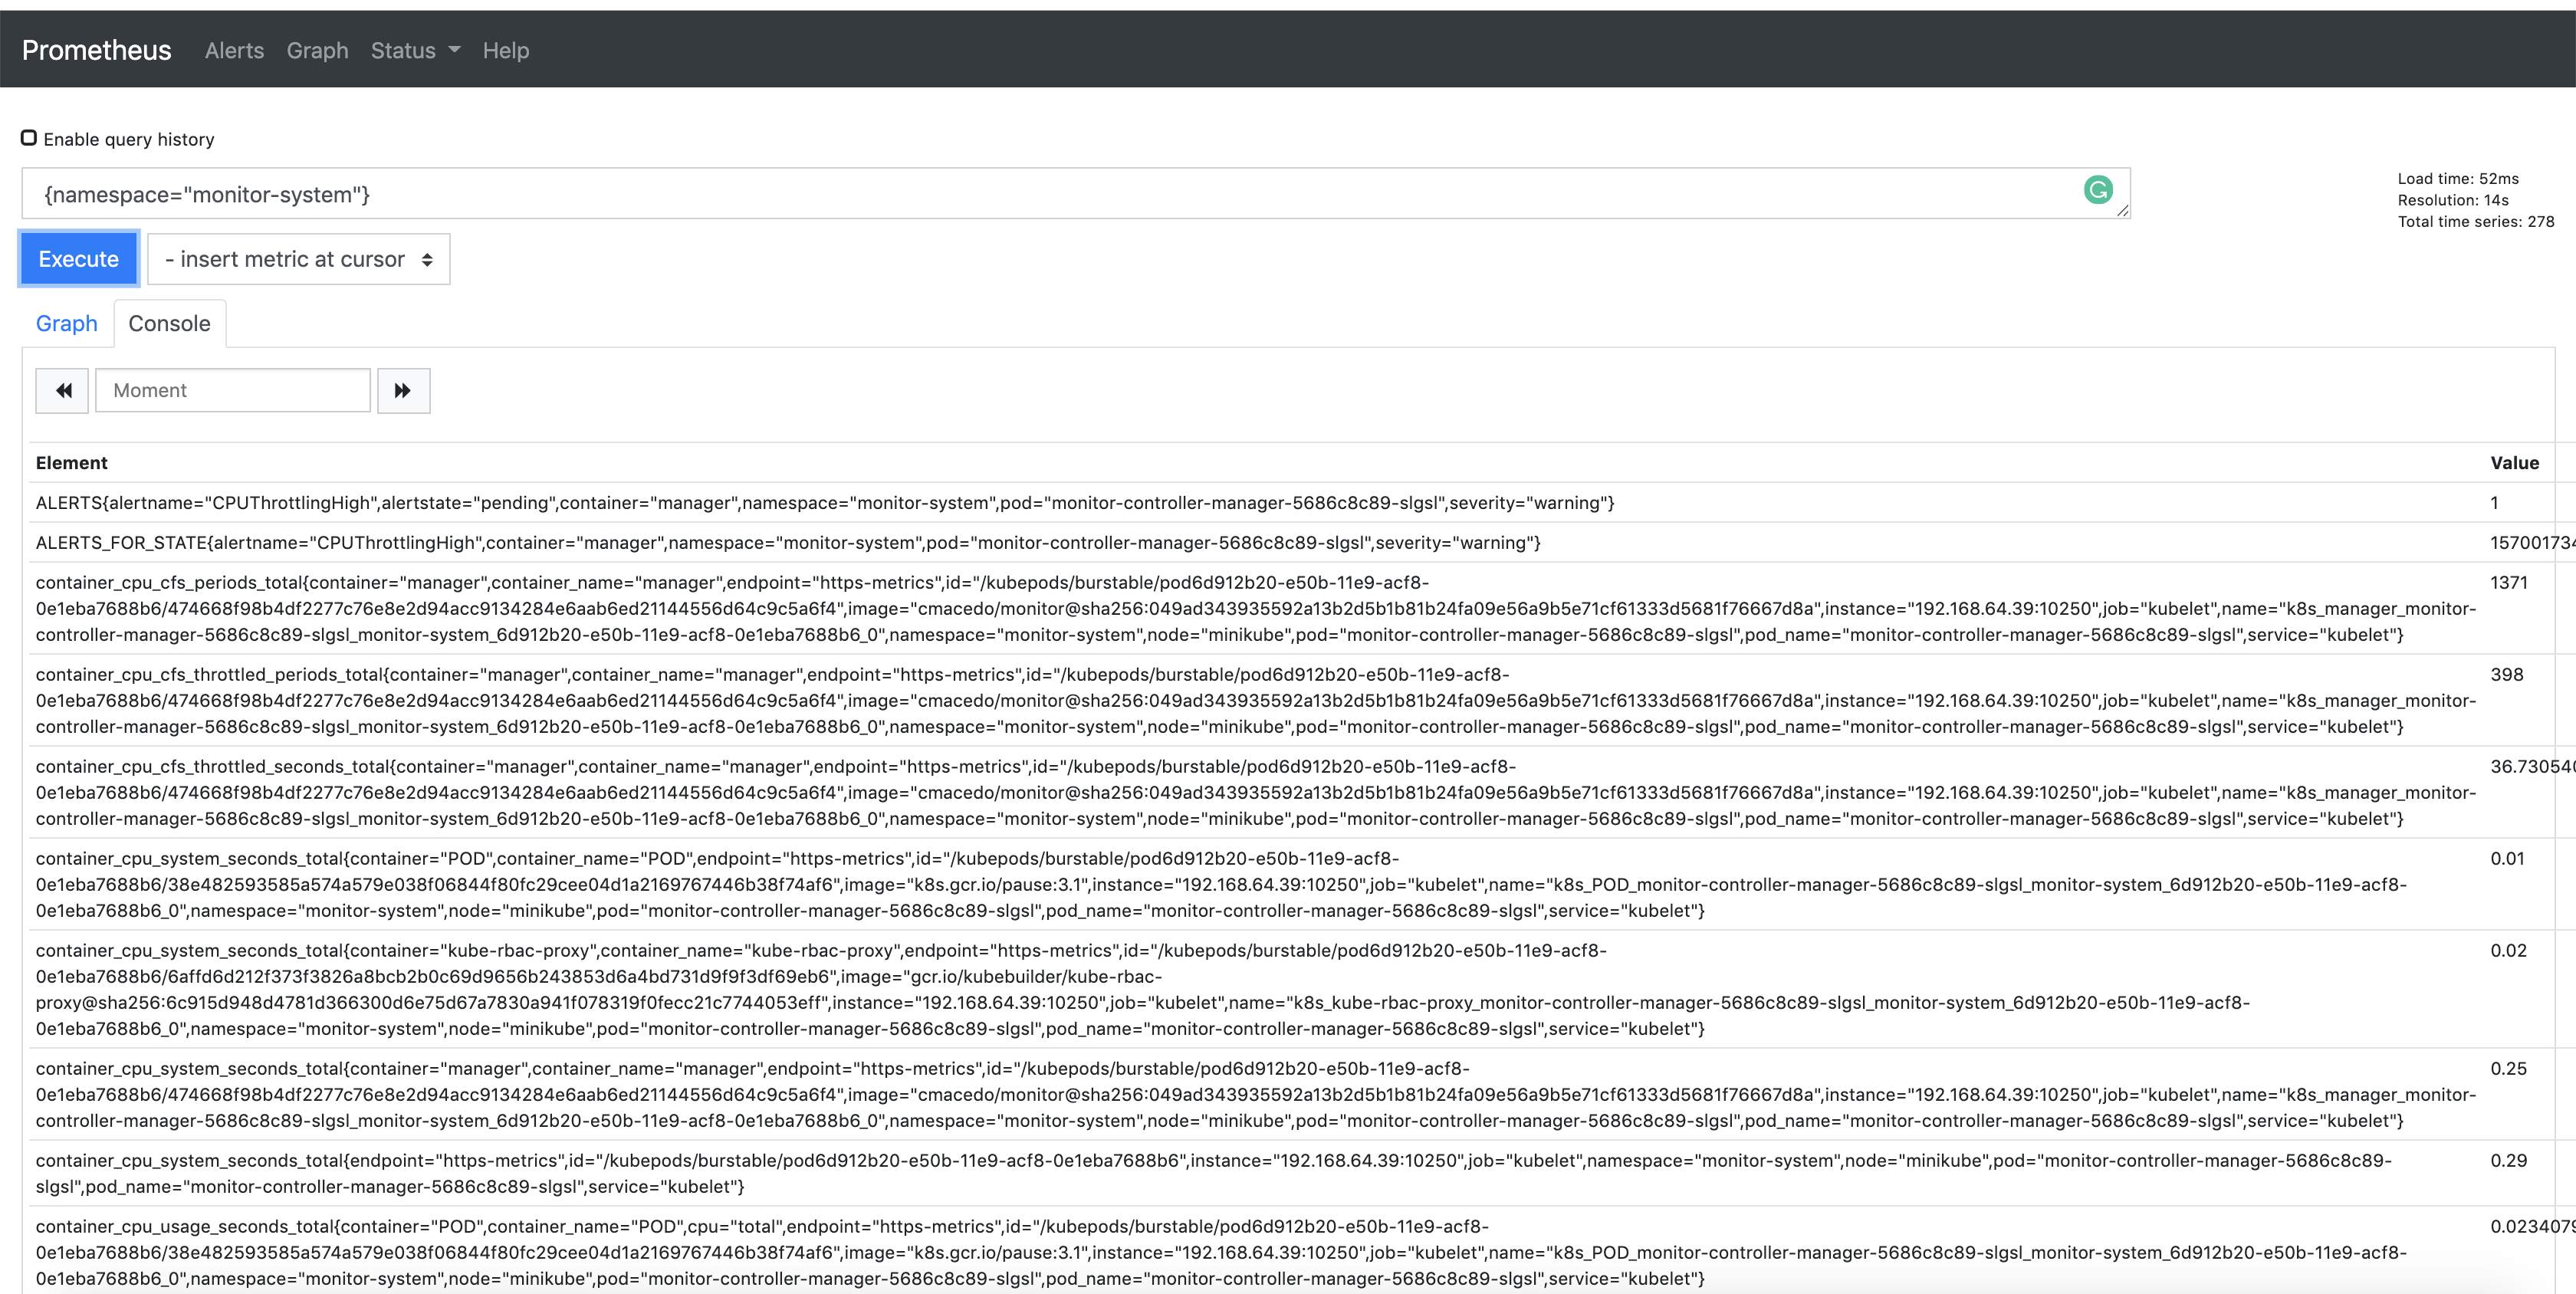
Also, notice that the metrics are exported by default through port 8443. In this way,
you are able to check the Prometheus metrics in its dashboard. To verify it, search
for the metrics exported from the namespace where the project is running
{namespace="<project>-system"}. See an example:
If you wish to publish additional metrics from your controllers, this
can be easily achieved by using the global registry from
controller-runtime/pkg/metrics.
One way to achieve this is to declare your collectors as global variables and then register them using init() in the controller's package.
For example:
import (
    "github.com/prometheus/client_golang/prometheus"
    "sigs.k8s.io/controller-runtime/pkg/metrics"
)

var (
    goobers = prometheus.NewCounter(
        prometheus.CounterOpts{
            Name: "goobers_total",
            Help: "Number of goobers proccessed",
        },
    )
    gooberFailures = prometheus.NewCounter(
        prometheus.CounterOpts{
            Name: "goober_failures_total",
            Help: "Number of failed goobers",
        },
    )
)

func init() {
    // Register custom metrics with the global prometheus registry
    metrics.Registry.MustRegister(goobers, gooberFailures)
}
You may then record metrics to those collectors from any part of your reconcile loop. These metrics can be evaluated from anywhere in the operator code.
In order to publish metrics and view them on the Prometheus UI, the Prometheus instance would have to be configured to select the Service Monitor instance based on its labels.
Those metrics will be available for prometheus or other openmetrics systems to scrape.
