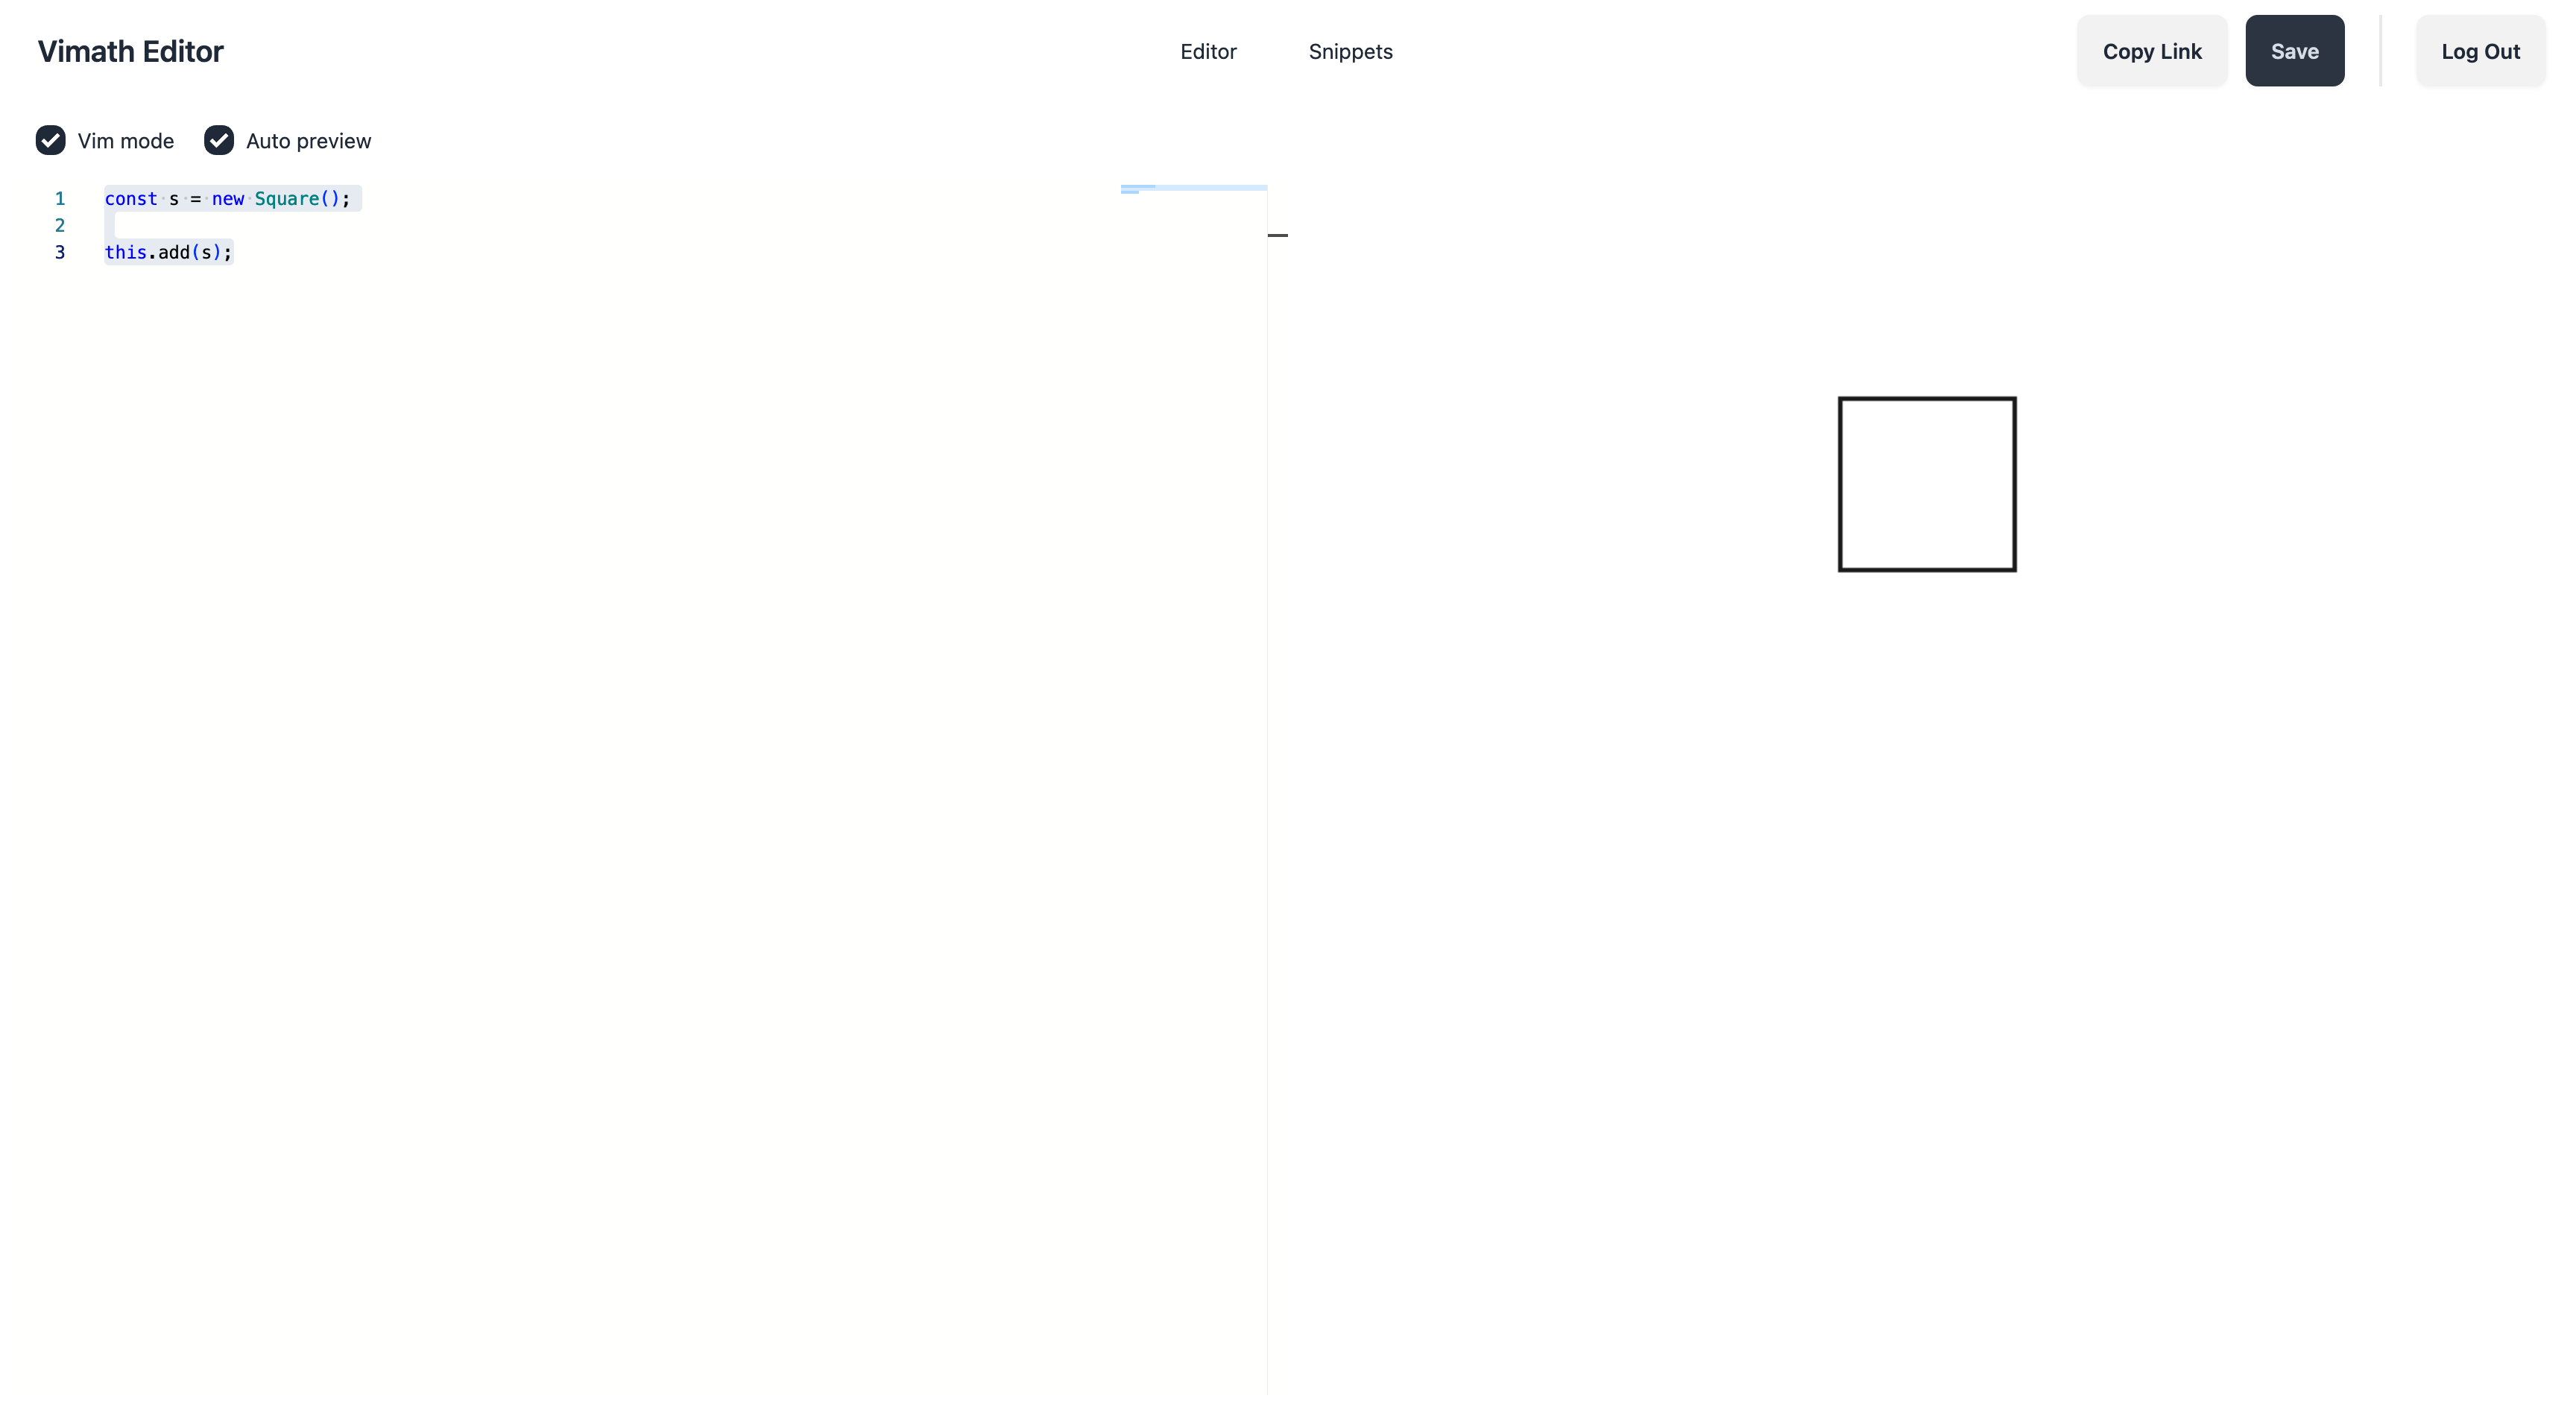
Vimath is a browser library for creating animatable and interactive visualizations. While it's general and flexible enough for any visualizations it's been built with math education and math visualizations in mind. Vimath is heavily inspired by the work Grant Sanderson (3Blue1Brown) has been doing with the the manim Python library.
Note: the library is still in alpha phase, so there may be some thrash in the API in the meantime.
npm install vimath --save
import { Scene, Square } from 'vimath';

class TestScene extends Scene {
    compose() {
        const s = new Square({ lineColor: Colors.red() })
            .shift([1, 2])         // Shift 1 unit right and 2 units up
            .rotate(Math.PI / 4);  // Rotate 45 degrees

        const t = new Triangle({ color: Colors.blue() })
            .scale(0.5);   // Scale down by 50%

        this.add(s, t);
    }
}

new TestScene().render();Modeled after manim's logo.
import { Scene, Tex, Circle, Square, Triangle, Group, LEFT, RIGHT, ORIGIN } from 'vimath';

class TestScene extends Scene {
    compose() {
        const v = new Tex({ text: '\\mathbb{V}', color: '#343434' }).scale(7);
        v.shift(LEFT(2.25), UP(1.5));

        const circle = new Circle({ color: '#87c2a5', lineColor: Colors.transparent() }).shift(LEFT());
        const square = new Square({ color: '#525893', lineColor: Colors.transparent() }).shift(UP());
        const triangle = new Triangle({ color: '#e07a5f', lineColor: Colors.transparent() }).shift(RIGHT());

        const logo = new Group(triangle, square, circle, v);
        logo.moveTo(ORIGIN);
        this.add(logo);
    }
}

new TestScene().render();import { Scene, Tex, Circle, Square, Triangle, Group, LEFT, RIGHT, ORIGIN } from 'vimath';
class TestScene extends Scene {
compose() {
const axes = new Axes({
xLength: 10,
yLength: 6,
xRange: [0, 1],
xStep: 0.25,
yRange: [0, 50],
yStep: 5,
xLabel: 'time (h)',
yLabel: 'distance (miles)'
});
const fn = x => 25 * x * x;
const p = axes.plot(fn).changeLineColor(Colors.green());
this.add(axes, p);
const p1 = axes.point(0.25, fn(0.25));
const p2 = axes.point(0.5, fn(0.5));
const p3 = axes.point(0.75, fn(0.75));
const p4 = axes.point(1, fn(1));
const tangent = new TangentLine({ plot: p, x: 0.5, color: Colors.pink(), length: 8 });
const centerPoint = new Dot({ center: p2, color: Colors.pink() });
this.add(
tangent,
new Dot({ center: p1, color: Colors.green() }),
centerPoint,
new Dot({ center: p3, color: Colors.green() }),
new Dot({ center: p4, color: Colors.green() }),
);
this.add(new Updater((pctComplete: number, starting: boolean) => {
const x = math.lerp(0, 0.99, pctComplete);
centerPoint.moveTo(p.pointAtX(x));
tangent.updateX(x);
}, { duration: 3000, easing: Easing.easeInOutCubic, repeat: true, yoyo: true, }));
}
}
new TestScene().render();I created a little playground where you can write/modify Vimath snippets and see the updates in real time. The playground also allows you to save your snippets so they can be embedded into web pages, Notion, Jupyter Notebooks, etc:
Vimath Playground: https://vimath-editor.bryan.blog
Accepting any and all contributions. Help with development, documentation, or examples would be greatly appreciated.


