Due to a host of issues and a pretty ugly implementation to begin with, it is no longer feasible for me to maintain this project. However, don't panic! I'm working on a new implementation in Python that should make everyone's lives much easier. I expect the first release soon! http://github.com/Graeme22/tastyworks-cli
Prerequisites: Git (https://git-scm.com/), Go (https://golang.org/)
- Clone the repository:
git clone https://github.com/Graeme22/tastypl.git
- Install the dependencies:
go env -w GO111MODULE=off
go get github.com/Graeme22/go-chart
go get github.com/golang/glog
go get github.com/shopspring/decimal
- Run the code on your CSV file (instructions on how to obtain below.)
go run tastypl.go -input yourcsvfile.csv -printpl -positions -chart
Note: On OSX, the full path to the CSV file must be specified.
tastypl is a Go program that imports your tastyworks transactions and figures out some statistics to help you track your performance and positions. The main motivation behind it was to track the net credit after rolls.
On the tastyworks desktop app, go to the History tab, and under "transactions" pick a start date that is before the creation of your account, then click the CSV button to export all the transactions to a file. You need all the transactions in the CSV file otherwise the numbers won't make sense. Note: Do NOT choose YTD, it outputs a completely different CSV! Use a custom date range. Also, make sure to scroll to the bottom of the transaction list in TastyWorks before exporting--it has a glitch and will not export the full history otherwise. Finally, sometimes stocks will go through splits, reverse splits, or other rare events that tend to not play nicely with this script. If that happens, you might see an error like:
expected symbol "USO 201016C00005500" but found "USO1 201016C00005500"
In this case, you'll need to edit your CSV file. Open it in something other than Excel (which has a tendency to screw up the formatting), then replace all instances of the number after the symbol with a space (so in this case 'USO1' would become 'USO ').
You may also see an error regarding the parsing of --. If that is the case, replace all instances of -- with 0.
Here is a simple example for a portfolio with an AAPL straddle, a BIDU position that has received an assignment, and a ROKU position that has been rolled.
----- Overall statistics ----
Number of transactions:    46    (in 97 days => 0.5/day avg)
Realized P&L:            2246.00
Commissions:              -37.00 (-1.65% of P&L)
Fees:                     -19.11 (-0.85% of P&L)
Interest:                 -72.43 (-3.22% of P&L)
Gross P&L:               2117.46 (~21.83/day avg, 94.28% of P&L)
Equity:                 -25000.00 (1 positions)
Adjusted Gross P&L:     -22882.54
Net money movements:    31000.00
Outstanding premium:     5673.00
Cash on hand:           14024.46
---- Realized P&L detail ----
/NQH8    80.00
BIDU   1148.00
PCLN    896.00
ROKU    122.00
----- Current portfolio -----
AAPL  (2 positions)
  Feb 16 short 1 $170 call @ 7.2 [BEP=177.20]
  Feb 16 short 1 $170 put  @ 5.35 [BEP=164.65]
  --> 170 straddle @ 12.55 net credit
BIDU  (3 positions) [RPL=1148.00]
  long  100 shares @ 250.00 (adj. cost basis 247.66)
  Feb 16 short 1 $217.5 call @ 7.4 [BEP=224.90]
  Mar 16 short 1 $250 put  @ 32 [BEP=218.00]
ROKU  (1 position) [RPL=122.00]
  Feb 16 short 1 $44 put  @ 4.78 [BEP=38.00]  (net credit 6.00)
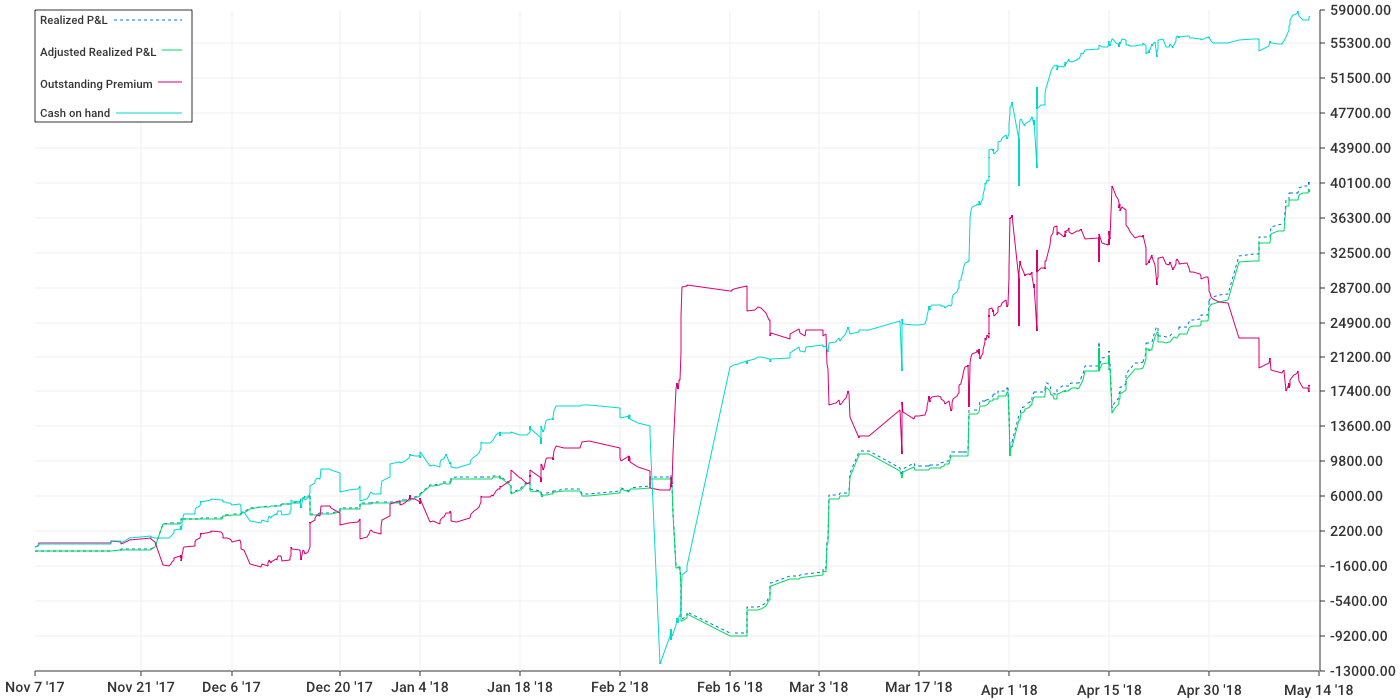
The -chart option generated a graph in a file called rpl.png that looks like this:
On the chart, "adjusted realized P/L" is the realized P/L net of commissions, fees, interest paid if any, etc. Outstanding premium is the amount of premium sold (if positive, bought if negative) at the price it was opened – the script does not track the mark of positions over time, only opening/closing prices, as it does not have access to any historical market data. Cash on hand should match what is shown in tastyworks' account balance.
tastyworks and tastytrade are not affiliated with the makers of this program and do not endorse this product. This program does not provide investment, tax, or legal advice. Options involve risk and are not suitable for all investors as the special risks inherent to options trading may expose investors to potentially significant losses. Futures and futures options trading is speculative and is not suitable for all investors.
THERE IS NO WARRANTY FOR THE PROGRAM, TO THE EXTENT PERMITTED BY APPLICABLE LAW. EXCEPT WHEN OTHERWISE STATED IN WRITING THE COPYRIGHT HOLDERS AND/OR OTHER PARTIES PROVIDE THE PROGRAM “AS IS” WITHOUT WARRANTY OF ANY KIND, EITHER EXPRESSED OR IMPLIED, INCLUDING, BUT NOT LIMITED TO, THE IMPLIED WARRANTIES OF MERCHANTABILITY AND FITNESS FOR A PARTICULAR PURPOSE. THE ENTIRE RISK AS TO THE QUALITY AND PERFORMANCE OF THE PROGRAM IS WITH YOU. SHOULD THE PROGRAM PROVE DEFECTIVE, YOU ASSUME THE COST OF ALL NECESSARY SERVICING, REPAIR OR CORRECTION.
